What are the Key Features of Tableau 9.0
Key Features of Tableau 9.0
The new Tableau 9 is packed with game-changing enhancements that take the experience of data analysis to a whole new level. New features like parallel processing are set to deliver massive performance improvements, while the new level of detail calculations will make once complicated table calculations child’s play. So here are the few important new features in Tableau 9.0
1. New options in Map
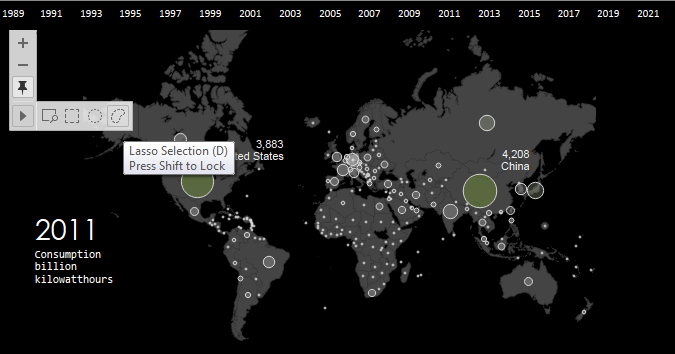
The “Tableau Classic” map has been removed from the Map Options. Hover over the map and the map toolbar is shown, the first button is a search tool allows you to search for geographic locations around the globe. Lasso tools have been improved in maps. There is now a circular and freeform polygon tool to select marks on a map.
2. Direct connector for SAS, SPSS, R – stats package files
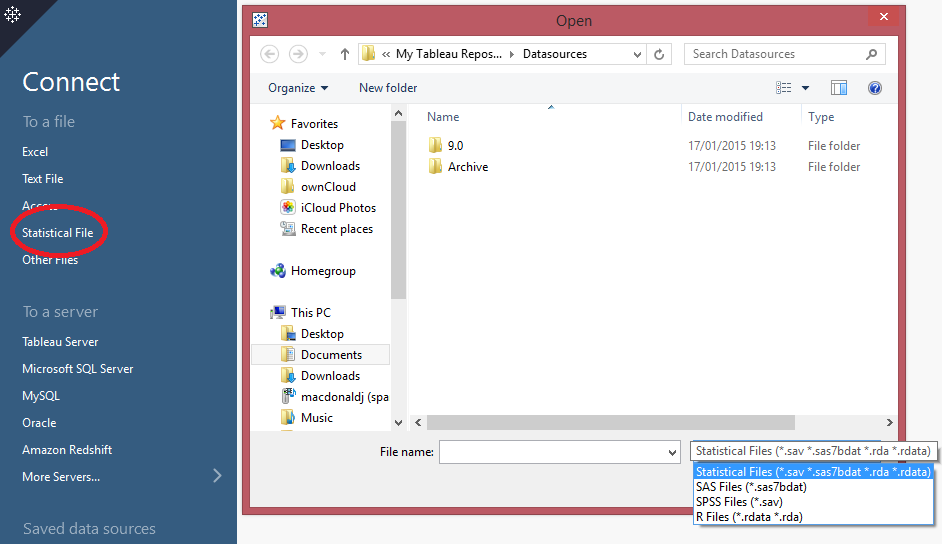
Stats files can now be visualized by Tableau. This new connector brings native support for a number of statistical package files including:
.sas7bdat – the file format used by SAS
.sav – the binary file format used by SPSS
.rdata, .rda – the file formats employed by the R statistical analysis package
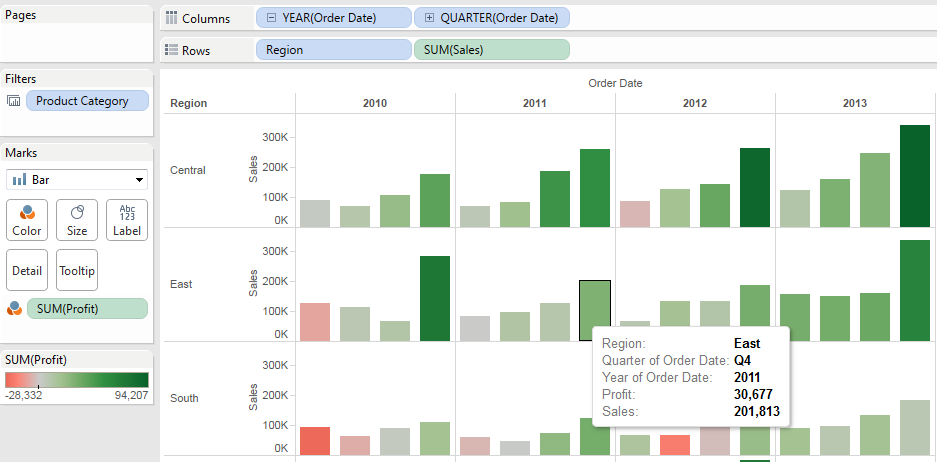
The speed of design is faster too along with speed of platform. Now: switch to the Analytics Tab and you have drag and drop analytics! For quick calculations double click a blank space in Rows, Columns, or Marks and type some code to create an Ad-hoc calculation.
4. Updated color window with hex values and color picker
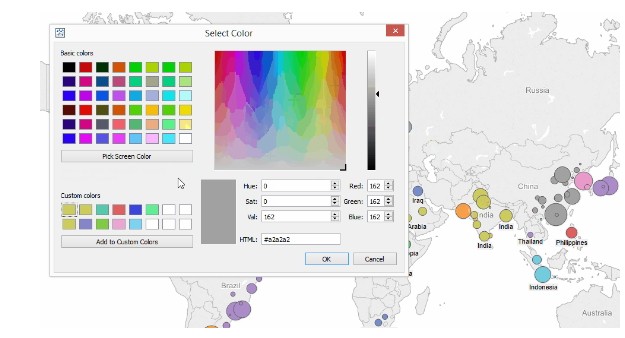
The new and improved color palette dialogue box now allows you to specify and see hex values for all the colors you’re using – very handy for putting together those custom color palettes, and what’s more you can now also pick a color from anywhere on your desktop and drop it into the palette.
5. Arrow to the right of the new calculation window
The new calculation window auto-completes your typing with suggested dimensions, measures and formulas. Click on the arrow to the right you get your formula drop-down, complete with explanations and a usage example. It’s a nice way to keep the interface clean while still giving you the option to search the formula list. While we’re on the subject, don’t forget to check out some of the new calculations introduced in v9, like the RANDOM(), HEXBIN, and REGEXP functions.
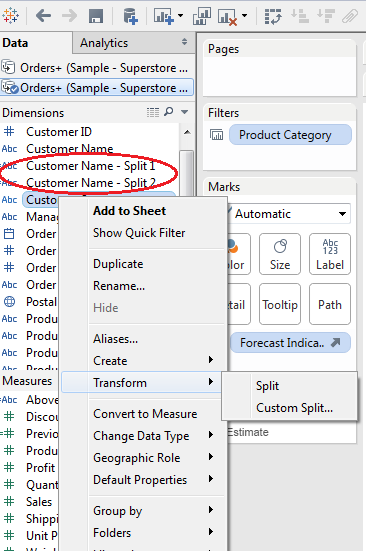
With this new feature you can convert text to columns in Tableau on a go. What typically used to be a job for Excel, SQL, or a calculated field of LEFTs and RIGHTs has now been made a one-click operation in Tableau. Just right-click on the dimension you want to split, navigate to the new ‘Transform’ menu and click Split. Tableau will automatically try to figure out the delimiter and split the data accordingly, but you can also choose Custom Split and specify the delimiter yourself if you like.
7. The new “Tableau Discover” side menu on the start page
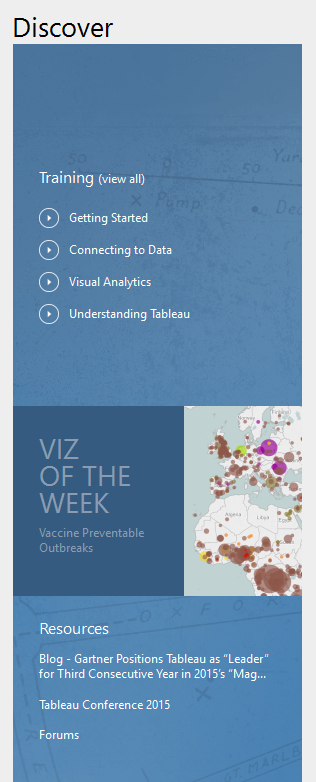
When you open Tableau v9 for the first time you’ll now notice a new menu on the right that alerts you to a bunch of handy Tableau resources, including links to training for beginners, a highlight section on the Tableau Viz of the Week.
8. “Tableau” button in the top left
Tableau now includes a handy “Tableau” button in the top left of the menu bar, which allows you to quickly flip between your viz and the Tableau Desktop start page.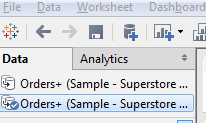
9. The “Add New Data Source” button drop-down menu
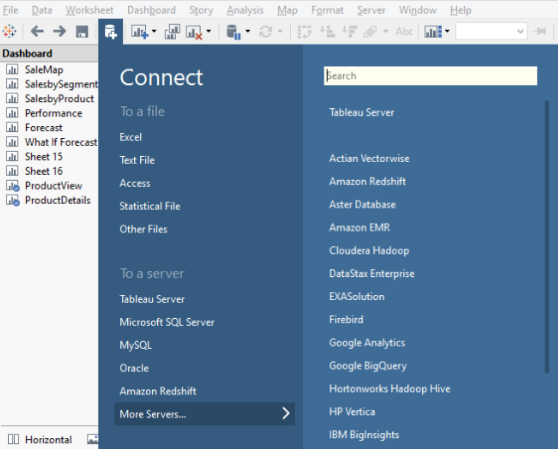
Clicking on the add new data source button in the menu bar now reveals a drop-down menu, which allows you to really quickly connect to a new data source, without having to navigate to another page
10. Tool tips stay shown until you move your mouse, rather than dropping off after a few seconds
In current versions of Tableau, a tooltip only stays alive for 8 seconds and then it disappears. Now in Tableau v9, tooltips stick around for as long as you leave your mouse in place. Furthermore, tooltips are now super responsive, populating with new data for whichever mark you’re hovering over in real-time. You can disable it as well using tooltip window
Are you looking for Tableau Implementation? Speak to our Tableau expert on: +1 404 631 6219
Or email at sales@bistasolutions.com

