Tableau – Quick Tips & Tricks

Here are few Tips of Using Tableau :

Note: We have used a Sample Superstore Excel source for these examples.

TIP # 1: Right Click Drag: Quick Field Property Selection

Normally when you select a field you need to drop the Dimension, Measure or Set in first then apply the SUM, Average or alteration of Field Property. However if you want to save yourself a click, you can right click, drag a field onto a worksheet by using a right click, drag once you let go. You will be prompted with a window showing all the possible field dimensional properties or measure calculations.

Tableau-Drop-Field


TIP # 2: RUNNING TOTALS

Create a visualization using the Year/Month level of the Date Fields. Add the Sales measure twice, and use a Bar for one mark, and Line for the other one.

Tableau-Dashboard

To see a “running total since inception”, simply add a “Running Total”, quick table calculation to the second sales measure. Note this is a dual axis chart.

TIP # 3: Chart Types – Side-by-Side Bar Chart

To examine the side-by-side bar chart, let’s first take three rows of vertical bar charts. These represent sales volume by state and are divided into the three different departments of our fictional company.

Tableau-Graph

Third view has two primary deficiencies. First, it limits the comparison of the state-level performance within a specific department. In other words, Technology sales performance can be compared across the different states, but it is far more difficult to compare Technology to Office Supplies.

Here’s where the side-by-side bar chart really shines.

Tableau-Side-by-Side-bar

The side-by-side bar chart is a great way to compare each category in each state and department together as separate business units. Immediately, we can see that all the three departments in California are the best. Perhaps surprisingly, the fourth-best performer is Washington’s Technology department.

One can also format this chart in different ways to highlight different aspects of your data (i.e. to tell a different story). I choose to colour-code all of the product categories so that if you want to visually scan a comparison of category to category, it will be easier.

There you have it. Now with a side-by-side bar chart, we can easily compare individual department performance within each state as well as on the whole.

If you’re interested in implementing Tableau for your business, you can get in touch with us at sales@bistasolutions.com.


Calculating Landed Cost in Odoo

  • by bista-admin
  • Oct 09, 2015
  • 0
  • Category:

Definition of Landed cost: The total cost of a landed shipment including purchase price, freight, insurance, and other costs up to the port of destination. In some instances, it may also include the customs duties and other taxes levied on the shipment.
It is the total price of a product once it has arrived at a buyer’s door.

In Odoo (OpenERP), we by default have a landed cost module,which had some limitations, so we add the functionality which overcomes these limitations and provide you an efficient way to calculate your selling price of the product by considering all these factors.

Process:

We add these Freight, Insurance etc cost as a product and differentiate it with the normal product.

Landed-Cost-in-odoo

The Service costs specify for each landed service gets calculated on the purchase order and define as a Total Landed cost.

For our client, we split these landed cost in different category like Order Level (Which get applied on the PO Order level), Order line level (PO line level calculation), per container (Calculated based upon no. of container PO has).

Also, we add the landed cost concept on the Purchase order and pass it to the Shipment of the product level.

Calculating-Landing-Cost

In the above figure, you can see the different Landed cost service which got apply for the Purchase order. These costs are getting populated on the purchase order base upon different conditions, like for the domestic PO, there are different landed cost than that of foreign PO.

The Landed Costs Total Untaxed shows the total value of the purchase order including these landed costs.

Following figure shows the landed cost which gets applied on the purchase order level and also give you bifurcation of the order level landed cost base upon the product quantity or product weight.

Calculating-Landing-Cost

Price Unit gives you information about the unit price of these products or unit prices of the lot that is getting created after the addition of the landed cost.

Our client also had Container scenarios, like one purchase order had the more than one container on which these products are shipped.

How-to-calculate-landing-cost

Price Unit gives you information about the unit price of these products or unit prices of the lot that is getting created after the addition of the landed cost.

Our client also had Container scenarios, like one purchase order had the more than one container on which these products are shipped.

Landing-cost-calculation-in-Odoo

So, we provide additional functionality to get information about landing cost which get applied to respected container.

Same procedure of calculation of landed cost is repeated for the shipment level if required.

Landed-cost-in-Odoo

Once the new lot is created, it will have these additional landed unit prices.

For more information regarding this module, please contact on sales@bistasolutions.com.


Odoo FosDick Warehouse Management Connector

Odoo FosDick Warehouse Management Connector

Fosdick is the warehouse services provider who manages all the stock and shipment operations. We have created Odoo FosDick Warehouse Management Connector

  1. Submitting the orders to FosDick – iPost to submit all the delivery orders to FosDick
  2. Get the tracking information from FosDick – Use Fosdick API to retrieve the status & the tracking number of each delivery order

1. Submitting Orders to Fosdick

  • Server Name: The hostname is used to send the orders.
  • Customer Name: The customer name, specific to the company, as provided by Fosdick; is used in the URL
  • Client Code: Defines the XML parameter ‘ClientCode’.
  • AdCode: Defines the XML parameter ‘adCode’ (“TEST”)
  • Logfile: Place to log the information
  • Debug Mode: By default, we log the execution of the batches (when submitted and when received with status); in debug mode we want to log each delivery orders submitted
  • Test Mode: Defines the content of the XML parameter “test¨
  • Write to File: An option to write the XML to a files with timestamps


Fosdick-Connector

Submit the orders.

To submit the orders, just run the scheduler and it will submit all the Ready to Transfer Odoo ERP Orders to Fosdick.

Fosdick-scheduler

2. To track order status, you require following parameters:

● URL
● Username
● Password
● Write to file : An option to write the XML to a files with timestamps
● Span Time : Number of days of shipments to retrieve

To track the orders, configure your tracking details in configuration form and click on button ‘Fetch Tracking’. It will track all the submitted orders.

Fosdick-odoo-connector

For more details regarding this module and connector email us on sales@bistasolutions.com or call on USA: +1 (858) 401 2332 / Other Regions +91 897 609 8988


ETL, ELT & ETLT Is Now Easy with Hadoop

ETL tools are basically used to migrate data from one place to another by performing three functions:

  • Extract data from sources like ERP or CRM applications : In the extract step, data has to be collected from several source systems and in multiple file formats, like the flat files with (csv) delimiters and files with XML extensions. There may also be a need to get the data from legacy systems, which store data in formats that are understood by very few people and nobody else uses it further.
  • Transform that data into a format that matches other data in the warehouse : The transformation process includes many data manipulation steps, like moving, splitting, translating, merging, sorting, pivoting, and many more.
  • Loading the data into the data warehouse for analysis: This process can be performed through batch files or row by row, in real time.

All the above processes sound simple but take days to complete the process.

ETL Process


“Power of hadoop with ETL”

Hadoop brings at least two major advantages to traditional ETL:

  • Ingesting huge amounts of data without having to specify a schema on ‘Write’.

 A prime property of Hadoop is the “no schema on-write”. This implies that you don’t have to pre-define the data schema before loading data into HDFS. This holds true for both structured data (such as point-of-sale transactions, details of call records, ledger transactions, and even the call centre transactions),as well as for unstructured data (like comments from users, doctor’s notes,  descriptions on insurance claims, and web logs) and social media data (from websites like Facebook, LinkedIn and Twitter). Irrespective of whether your input data has explicit or implicit structure, one can quickly load it into HDFS, which will then be ready for downstream analytic further processing.

  • Unload the transformation of input data by parallel processing at scale.

Once the data is loaded in Hadoop you can perform the traditional ETL tasks like cleansing, aligning, normalizing and combining data by employing the massive scalability of MapReduce function. Hadoop also permits you to keep away from the transformation bottleneck in the old and typical ETLT, by unloading the ingestion, transformation, and integration of unstructured data into the data warehouse. Since Hadoop allows you to use more data types than ever before, it enriches your data warehouse which otherwise would not be feasible. Due to its scalable performance, you can appreciably speed up the ETLT jobs. Adding on, since data saved in Hadoop persists for a much longer period, one can provide more granular details of the data via EDW for high-fidelity analysis.

For more Information or Implementation services, you can contact our expert on sales@bistasolutions.com or call on USA: 404 631 6219 / Other Regions +91 897 609 8988

How Hadoop Can Overcome the Challenges with Big Data Analytics

No doubt that the new wave of big data is creating new opportunities but at the same time it is also creating new challenges for businesses across all industries. Data integration is one of the important challenges that many IT Engineers are currently facing. The major problem is to incorporate the data from social media and other unstructured data into a traditional BI environment.

Big-data

Here we have discovered a robust solution to overcome data-related challenges.

We are talking about “Hadoop”, a cost-effective and scalable platform for BigData analysis. Using the Hadoop system instead of Traditional ETL (extraction, transformation, and loading) processes gives you better results in less time. Running of Hadoop Cluster efficiently implies selecting an optimal framework of servers, storage systems, networking devices, and soft wares.

Generally, a typical ETL process will extract data from multiple sources, then cleanse, format, and loads it into a data warehouse for analysis. When the nature of source data sets is large in size, fast-growing, and not in a structured format, traditional ETL can become the bottleneck, because of its complex, expensive,e and time-consuming process to develop, operate and execute.

Data-warehousing title=

Fig #1: Depicts the Traditional ETL Process

Hadoop

Fig#2: Depicts ETL offload Hadoop.

Apache Hadoop for Big Data

Hadoop is an open-source framework that is based on a java programming model that supports the processing and storing of large data sets in a distributed computing environment. It runs on a cluster of commodity machines. Hadoop allows you to store petabytes of data reliably on a large number of servers while increasing performance cost-effectively, by just adding inexpensive nodes to the cluster. The reason for the scalability of Hadoop is the distributed processing framework known as “MapReduce”.

MapReduce is a method to process large sums of data in parallel while the developer only has to write two codes which are “Mapper” and “Reduce”. In the mapping phase, MapReduce takes the input data and assigns every data element to the mapper. In the reducing phase, the reducer combines all the partial and intermediate outputs from all the mappers and produces a final result. MapReduce is an important advanced programming model because it allows engineers to use parallel programming constructs without having to know about the complex details of intra-cluster communication, monitoring the tasks, and handling failures.

The system breaks the input data set into multiple chunks, and each one of them is assigned a map task that processes the data in parallel. The map function will read the input in the form of (key, value) pairs and produce a transformed set of (key, value) pairs as the output. During the process outputs of the map, tasks are shuffled and sorted and the intermediate (key, value) pairs will be sent to the reduced tasks, which will group the outputs into the final results. To perform processing using MapReduce, the JobTracker and TaskTracker mechanisms are used to schedule, monitor, and restart any of the tasks that fail.

The Hadoop framework includes the Hadoop Distributed File System (HDFS) which is a specially designed file system with a streaming access pattern and fault tolerance capability. HDFS stores a large amount of data. It divides the data into blocks (usually 64 or 128 MB) and replicates the blocks on the cluster of machines. By default, three replications are maintained. Capacity and performance can be increased by adding Data Nodes, and a single Name Node mechanism.

For more information or Implementation services, you can contact our expert at sales@bistasolutions.com or call on USA: +1 (858) 401 2332 

How Internet of Things (IOT) will Change the Future of ERP

 The Future of ERP

internet_of_thing

Many websites and  journals  talk about the history and evolution of ERP . Let’s today understand how the industry has  evolved along the last few decades and where is the  ERP system is heading to catch up the ever growing face of industrialization.

• Industry 1.0 was the first ever step towards evolution, this was when mechanical engines came into being. The production equipment was driven by water and steam power.

• Later, in Industry 2.0 mass production was achieved by vision of labor and use of electrical energy.

• Industry 3.0 was all about automation of processes with the help of electronics and IT. This was the first time the world got acquainted to the systems which did their job.

• Today, the world awaits Industry 4.0, where all our physical machining will be managed through the sophisticated electronic/IT systems that people built. So basically, it is the advent of cyber-physical systems. We will have sophisticated cloud based ERPs work along with the machine equipments and sensors in our production plant to manufacture the most popular item of the season exactly as per market demand. Isn’t that fascinating?

This rings a bell – IoT (Internet of Things )

Internet of things is a widely popular area of interest for many. Imagine this working with your system to seamlessly analyze and execute your manufacturing. This is the future of IT industry, and I won’t be wrong to say – this is the future of ERP.

iot

Today’s cloud based ERPs are no less than a wonder, they are completely browser based and have absolutely no limit. From marketing, demand planning, sales, manufacturing, purchase to accounting, it can do just everything that you need. Its modular built makes easier for maintaining and evolving with the market demand. The next big thing we’ll know about  its compatibility with IoT.

Today ERPs have the ability to talk to other systems flawlessly to communicate crucial data. Why can’t an ERP then talk to an internet enabled device? Why can’t we collect data gathered by the device through its sensors about the manufacturing tools and equipment? All of these questions have definite answers, and that is the reason some of us have already started on the quest from “why can’t we?” to “how can we?” .

The first step towards Industry 4.0 is to have a futuristic ERP, which looks at your company ahead of you. We can assist you to make this leap. For more information you can consult our experts on sales@bistasolutions.com or call on USA: +1 (858) 401 2332 / Other Regions +912266219900


Common Mistakes While Implementing Business Intelligence Solutions

implementing-Bi

Today in this article we would like to highlight some of the common mistakes most of the companies do while implementing Business Intelligence Solutions.

1. Requirement Gathering Mistakes:

– Jumping to design before getting the requirements. Requirement gathering is about building the right system and design is about building the system right
-Gathering requirements for a BI implementation is challenging as it involves a broad scope. It offers potential for use of data and analytics, business culture, agility and adaptability, continuous improvement and much more.

2. Project Planning Mistakes:

– Generally organizations try to do everything at once by bundling their BI implementations with other IT projects
– Failing to get everyone on the team behind the project

3. Rushing into Implementation:

– A rushed and quick implementation often leads to an unsuccessful implementation
– Frustrates client and the management alike

4. Solution that is not scalable and adaptable:

– Choosing a solution that’s not agile
– Not choosing a solution that can grow, or adapt, to business needs

5. Too much or too few BI software tools:

-Too many tools lead to a lot of confusion and soaring training costs. Too few tools frustrate the users
-Not thinking strategically about the toolset, recommended by ERP vendors

Conclusion – A BI implementation can take lot of effort and money unless planned and executed well with experience. Bista Solutions has worked on medium to large scale BI deployments with success. Do reach out to us if you are looking for a BI partner, we would be more than glad to bring our experience

For more information you can consult our experts on  sales@bistasolutions.com or call on USA: 404 631 6219 / Other Regions +91 897 609 8988

ERP Failures and common mistakes in choosing ERP

ERP is critical software and the chances of ERP failures are always with it. ERP is a ballgame, not many people play it well. But, what is even worse, some don’t know they aren’t playing well, there are many reasons for ERP failures. Choosing an ERP solution is another ballgame, whose story is no different. Many of us must have read articles on how to choose an ERP, what parameters to look for while approaching vendors, partners, or solution providers, and what common ERP failures needed to keep an eye on. But not many emphasized the commonplace misconceptions or mistakes made while choosing an ERP. Let’s address a few common mistakes made when an organization chooses an ERP.

ERP failures

  • Engaging The Essential Resources:

Companies fail to understand the importance of an ERP implementation project and possible ERP failures. Many times, the right resources are not included. Organizations do not plan well in advance for the activities and tasks needed through the implementation. The solution provider is well equipped with all the tools to be able to deliver as per the timeline, but companies need to reciprocate likewise as well. All of this results in the quality of implementation delivery and removes the chances of ERP Failures. And then the solution provider, or at times the ERP technology takes the blame.

The best way to avoid ERP failures from happening is to set priorities right from the beginning. Organizations should engage crucial team members from the very start. ERP tools touch all the forefronts of your company, so it is essential to have people from all the various departments participate in the process.

  • Implementation Timeline:

Some ERP vendors claim to have their products easy to install, and once installed the company can run on it flawlessly. Well, it never really works that way. The next common misconception we’ll talk about is the implementation timeline.

Companies think of ERP solutions as a plug and play tools. ERPs are systems that need to be designed for the company, as per requirements. This is not a one-day job, it takes time and resources. Huge implementations can go up until 3 quarters of a year. if done methodically. Solution partners take resort to implementation methodologies, many times it is technology-specific. The project is divided into phases, with intermediate milestones.

Teams are deployed, with dedicated skill sets for niche tasks in the implementation. Resource allocation from either end is essential. Dedicated resources from the organization are a must, they can work with the solution partners throughout the implementation tenure. Changing the resource from time to time leads to the implementation of ERP failures.

  • Best Practices:

Different organizations have different business processes, different scenarios, and different needs from their ERP. But organizations fail to understand that each ERP is built based on some best practices across the industry. Implementation partners will help to bridge the niche need, but the vast majority of business processes should be following best practices. Many ERPs have the best practices standardized, these are moduled or bundled along and can be deployed as per customer needs. Companies must always remember, less customization equals less possibility of breakage. Implementations that are more inclined toward best practices are more successful compared.

  • Speed and Agility:

Today’s business runs at the speed of thought. And if the ERP fails to catch up, you always end up with one wheel behind the finish line. Speed is a relative term, and for many ERPs, it’s dependent (on server capacities, locations, etc). Organizations typically fall prey to the speed and agility demonstrated by the vendor or solution provider. The demos presented are generally hardwired and preset on servers or local machines. It thereby becomes difficult to understand the true ability of an ERP. The best way to tackle it is to run a trial instance yourself. A real-life demo!

Solution providers can enable organizations with trial versions that can run for a couple of weeks. Organizations can set up basic stuff there and learn whether the speed is up to the mark.

  • Security:

Companies capture massive confidential data. This can be customer credit card credentials or their financials for that matter. But while choosing an ERP, many times they overlook the need of having a secure system to handle the data as cleanly as it should.

Companies need to choose a secure ERP. Some systems can be hosted locally, on the premises. In such scenarios, data security is often overlooked. Some ERPs come with very secure database backing. Surprisingly some cloud-based solutions are more secure than on-premises systems. There are ERP vendors which claim to be as secure as any banking system. Companies must not miss checking the security norms of ERPs before implementation.

  • TCO:

The total cost of ownership of any product, especially that of an ERP system, has many components. Some ERPs can be completely owned by the company, while some are sold based on the subscription model. Today is the day of cloud ERPs, which dramatically reduce the TCO of the organizations owning it. Many companies miss computing the TCO for an ERP before investing in it. This is something all companies must do.

An attractive TCO will also get your return on investment sooner and will make it look much better compared to a very short period. Today’s cloud offerings claim to get a healthy ROI within months.

  • Support Mechanism:

Many ERP products provide after-sales support. Not just that, many implementers do that too. It is essential to choose your support channel wisely. Most of the time, the product company provides product support and fails to cope with the implementation specifics. Moreover, they charge a fortune for each ticket. This is a commonplace problem. As opposed, the implementation companies also provide after-sales support. If need be, they also have some reservations about the production company itself. It is more advisable to go with your implementation partner for support, as he is the one who knows your ERP better than any other.

  • Test Environment:

Customers tend to think, if we hire expert implementers we won’t need test environments. This is a myth! Test environments are not just for implementation partners to test. This is where the company can test during the acceptance testing, the future phases can be rolled out, the sample data can get in, and the users can be trained. If you are planning to do away with the test environment, you’ll have to compromise on a lot.

Test environments are typically instances wherein the implementation of mock-ups can be configured. Maintaining a backup of the customizations becomes so easy with the test environments in the picture. Cloud ERPs of the day have compatibility to fully replicate the test environment as per your live instance.

  • Data Migration:

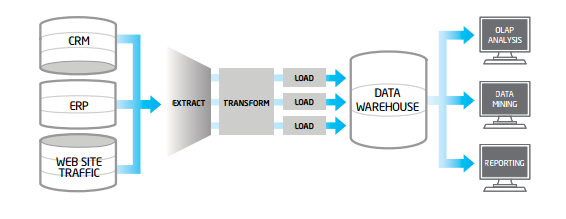
Data migration for many is just like uploading files on the internet. Well, it isn’t only about uploading. Companies tend to pay less attention to data migration activity, whereas data is the backbone of any ERP. A considerable fraction of migrating systems goes into migrating data. Different ERPs have different data structures or tables, it requires mapping efforts to push data the way it is needed.

Data migration is a combination of many tasks, namely planning, identifying and removing data redundancy, data hygiene, mapping, and importing/uploading. The result is significant and gives the true look and feel to an ERP. Implementers are equipped with a data migration skill set and help in pinpointing the effort estimate in this aspect.

  • Discontinuing Legacy System:

The system which you were using before the advent of your new ERP is the legacy system. Many companies conveniently forget to discontinue the legacy system. Any system comes with a cost, and continuing it for no reason means an unnecessary cost to the company. Some organizations think of legacy systems as a backup plan, on which they can fall back on. But the reality is that the fallback system never shows the true picture. Once a new ERP comes on board, the legacy system is not updated, and transactions stop flowing in unless deliberately entered. The best recommendation is to keep a single version of the truth, many versions can be delusive.

If you are looking forward to implementing an ERP Solution, You can consider Bista Solutions for ERP Implementation services. We are partnered with leading ERP Solutions including Odoo – Open Source ERP, and Ramco, For more information, you can consult our experts at sales@bistasolutions.com and call on the USA: +1 (858) 401 2332 


Automate your Purchase Requisition Process with ProcessMaker

Maintaining and managing corporate spending is consider being really critical task, but with the help of ProcessMaker it has been turned into a simple process automated process than you imagine.

ProcessMaker has core capabilities which will enable you to design and automate your organization approvals on the Purchase budget.
Today in this article we would like to show you that how you can design your Purchase Requisition process in ProcessMaker

Complete Process of Purchase Requisition will look like this.

purchase-requisition

2. Login Screen:

Login screen for ProcessMaker.

ProcessMaker Login

3. View after Login

Inbox view after login in to ProcessMaker.

purchase-requisition

4. Starting New Case

We can start new case by clicking ‘Start Case’ button in Process Information frame.

processmaker-case-start

5. New Case

processmaker-new-case

6. Filling Form

processmaker-form-filling

7. Assigning Case Step:

processmaker-assigning-case

8. Email Notification with link to respective case:

After assigning the step request information is notify by Auto Generated email notification with pre-design template to the next user.

Processmaker approval

9. Case Received by Department Head:

The request submitted by Applicant will be received his manager

Case-received-in-processmaker


10. IT Head Approval:

For example, if a person has requested for IT Asset, than after approval it will go to the IT manager.

it-approval

11. Approval Committee Case:

Approval Committee Case

12. Approval Committee Head Case:

Approval Committee Head Case

13. Purchase Department Case:

Here the purchase Manager will get all the information of the purchase request along with the Applicant name and approval date & time.

Purchase Department Case

14. End of Process:

14. End of Process:

15. Request Acceptance Email Notification:

Once the request gets approved by everyone the Applicant will get an auto generated notification along with auto generated output document in the form of attachment.

Request Acceptance Email Notification

16. OUTPUT Document of Process:

OUTPUT Document of Process

17. Request Rejection Email Notification:

If manage rejects purchase request an email notification will goes to the Applicant along with Case no of request, time of rejection and reason of rejection.

Request Rejection Email Notification

I hope this document is helpful, for more information or for the demo request of ProcessMaker email us on sales@bistasolutions.com

What If Analysis Scenario in Tableau

Parameters are one of the most powerful features available in Tableau to analyze and interact with data. Parameters are dynamic values that can replace constant values in calculations. For example, you may create a calculated field that returns true if Sales is greater than $500,000 and otherwise return false. You can replace the constant value of “500,000” in the formula with a parameter that you can change dynamically using the parameter control.

In this post we will use parameters feature to create a “What-if” analysis. A “What-if” analysis is the process of changing the values a parameter to see how those changes will affect the outcome of data in a Tableau worksheet.

Let’s use superstore data that comes with Tableau desktop. We will analyze Gross Profit % (GP%) from the data set and build a KPI that would help us in identifying months that have exceeded the Profit Target set by a parameter.

  • Create a calculated field with GP% = sum([Profit])/sum([Sales])
  • Filter out the data for 2013 year in “Filters” pane. Also, setup a quick filter with single value list
  • Create a view like below with order date in row shelf and GP% in column shelf


Tableau Bi

  •  To create a parameter, right click in the Parameters window in the bottom left corner of the sheet view and select “Create Parameter”. You will have six data type options to choose from. We will select float data type as GP% is best represented in decimals. Name the parameter as GP Target. Let’s keep the current value as 0 (which will be default value when you use parameter for the first time). Choose display format as “percentage” with one decimal point. Giving a “range” would specify the lower and upper limit of the parameter. Here we will take it as 0 and 1, where 1 being highest (100%) and 0 being the lowest (0%) with increment of 5% (0.05 step size).

Tableau-what-if-analysis

  •  A parameter is a dependent variable which means it does not do anything on its own. There has to be a condition defined that would allow us to use the parameter. In this what-if analysis we want to see whether GP% was achieved in a particular month or not. So, we will create a calculated field that would satisfy the condition if the GP% is greater or equal to GP Target

Tableau

  • Drag the calculated field “Profit KPI” from the above step and drop it in color shelf of marks card

Tableau-What-if

  • Last step is to right click on the parameter “GP Target” and select “show parameter control”
    Your first what-if analysis is ready! As you move the “GP Target” slider, you will have the months highlighted (in blue or red) if they have achieved the profit target or not.

What-if-in-Tableau

For more information related to Tableau, kindly email us on sales@bistasolutions.com.