5 Statistical Methods For Forecasting Quantitative Time Series

Times Series Algorithm

Time is one of the most important factors on which our businesses and real-life depend. But, technology has helped us manage time with continuous innovations taking place in all aspects of our lives. Don’t worry, we are not talking about anything which doesn’t exist. Let’s be realistic here!

Here, we are talking about the techniques of predicting & forecasting future strategies. The method we generally use, which deals with time-based data is nothing but “Time Series Data” & the model we build IP for that is “Time Series Modeling”. As the name indicates, it’s working on time (years, days, hours, and minutes) based data, to explore hidden insights of the data and trying to understand the unpredictable nature of the market which we have been attempting to quantify.

Contact Us

TIME SERIES:  

The time series data used to provide visual information on the unpredictable nature of the market we have been attempting to quantify and trying to get a grip on that.

An Ordered sequence of observations of a variable or captured object at an equally distributed time interval. Time series is anything that is observed sequentially over time at regular intervals like hourly, daily, weekly, monthly, quarterly, etc. Time series data is important when you are predicting something which is changing over time using past data. In time series analysis the goal is to estimate the future value using the behaviors in the past data.

There are many statistical techniques available for time series forecast however we have found a few effective ones which are listed below:

Techniques of Forecasting:

    • Simple Moving Average (SMA)
    • Exponential Smoothing (SES)
    • Autoregressive Integration Moving Average (ARIMA)
    • Neural Network (NN)
    • Croston

METHOD-I: SIMPLE MOVING AVERAGE (SMA)

Introduction:

A simple moving average (SMA) is the simplest type of technique of forecasting. A simple moving average is calculated by adding up the last ‘n’ period’s values and then dividing that number by ‘n’. So the moving average value is considered as the forecast for the next period.

Why Do We Use SMA?

Moving averages can be used to quickly identify whether selling is moving in an uptrend or a downtrend depending on the pattern captured by the moving average.

i.e. A moving average is used to smooth out irregularities (peaks and valleys) to easily recognize trends.

SMA Working Example:

Let us suppose, we have time series data, to have a better understanding of SMA, Where, we have the graphical view of our data, in that we have twelve observations of Price with an equal interval of time. After plotting our data, it seems that it has an upward trend with a lot of peaks and valleys.

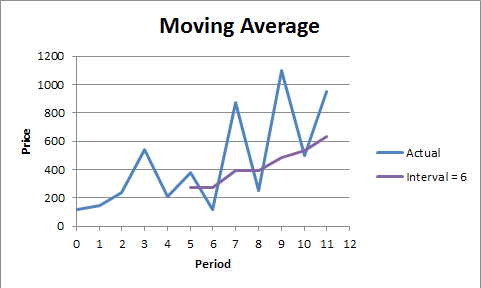
Conclusion: The larger the interval, the more the peaks and valleys are smoothed out. The smaller the interval, the closer the moving averages are to the actual data points. The SMA deal with historical data having more and more peak and valleys. Probably it would be stock data, retail data, etc.

METHOD II: EXPONENTIAL SMOOTHING

Introduction:

This is the second well-known method to produce a smoothed Time Series. Exponential Smoothing assigns exponentially decreasing weights as the observation gets older.

Why Do We Use Exponential Smoothing?

Exponential smoothing is usually a way of “smoothing” out the data by removing much of the “noise” (random effect) from the data by giving a better forecast.

Types of Exponential Smoothing Methods

  • Simple Exponential Smoothing: –

If you have a time series that can be described using an additive model with a constant level and no seasonality, you can use simple exponential smoothing to make short-term

forecast.

  • Holt’s Exponential Smoothing: –

If you have a time series that can be described using an additive model with an increasing or decreasing trend and no seasonality, you can use Holt’s exponential smoothing to make

short-term forecasts.

  • Winters’ Three Parameter Linear and Seasonal Exponential Smoothing: –

If you have a time series that can be described using an additive model with increasing or decreasing trend and seasonality, you can use Holt-Winters exponential smoothing to make short-term forecasts.

Graphical Views:

Exponential Smoothing:

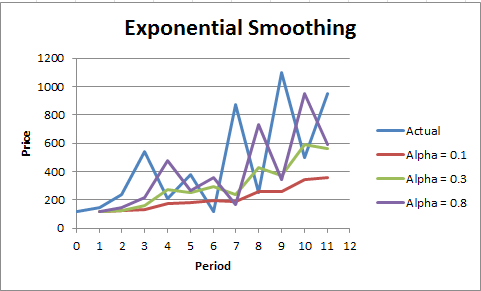
Here, we have an alpha value that is smoothing constant and this method is called the simple exponential smoothing method which considers the other two factors as constant (i.e. Seasonality & Trend). Double’s (Holt’s) Exp. Smoothing & Winter’s Exp. Smoothing Methods dealing two factors i.e. Trend and Seasonality (i.e. Beta & Gamma).

Conclusion: Larger the alpha, the closer to the actual data points and vice versa. This method is suitable for forecasting data with no trend or seasonal pattern (alpha = Smoothing Constant).

METHOD-III AUTOREGRESSIVE INTEGRATED MOVING AVERAGE (ARIMA)

Autoregressive Integrated Moving Average (ARIMA):

A statistical technique that uses time series data to predict the future. The parameters used in the ARIMA are (P, d, q) which refers to the autoregressive, integrated, and moving average parts of the data set, respectively. ARIMA modeling will take care of trends, seasonality, cycles, errors, and non-stationary aspects of a data set when making forecasts.

Understanding ARIMA Model in General Terms: –

How to Understand ARIMA model?

To understand this, we can refer to a real-time scenario that is a sugar cane juicer, from the juicer it is difficult to extract all the juice in one go, so the shopkeeper repeats the process several times till there is no more juice left in the residual. That’s how ARIMA works, the idea with ARIMA models is that the final residual should look like white noise otherwise there is juice or information available in the data to extract.

How Do We Use ARIMA Model?

ARIMA checks stationarity availability in the data, the data should also show a constant variance in its fluctuations over time. Getting the proper information about the parameter used in ARIMA is based on the “identification process” which was purposed by Box-Jenkins.

When Do We Use ARIMA Model?

As we all know ARIMA is mainly used to project future values using historical time series data. Its main application is in short forecasting with a minimum of 38-40 historical data points with a minimum number of outliers. If you do not have at least 38 data points, then it is advisable to look for some other methods.

Working Example of ARIMA

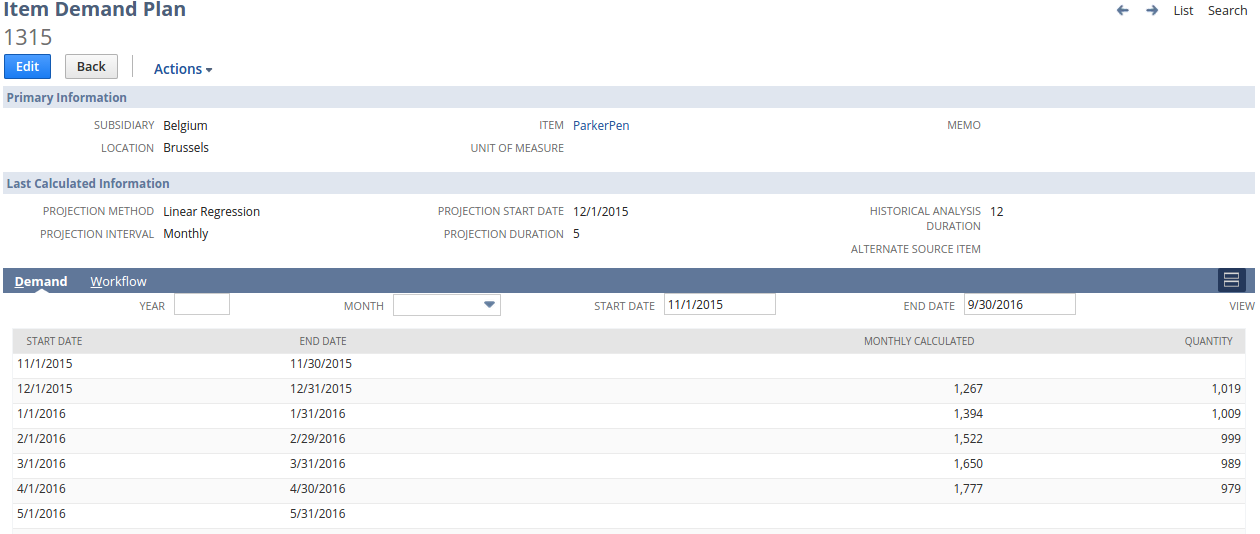
Here, we are trying to understand ARIMA using quarterly European retail trade data from 1996 to 2011. The data are non-stationary, with some seasonality, so we will first take a seasonal difference. The seasonally differenced data are shown in Fig. These also appear to be non-stationary, so we take an additional first difference and maybe next if required. Shown in Fig.

As we considered the seasonal ARIMA model which first checks their basic requirements and is ready for forecasting. Forecasts from the model for the next three years are shown in Figure. Notice how the forecasts follow the recent trend in the data (this occurs because of the double differencing).

Conclusion: – It works best when your data exhibits a stable or consistent pattern over time with a minimum amount of outliers.

METHOD-IV NEURAL NETWORK

Introduction:

ANN: – Artificial neural network (ANN) is a machine learning approach that models the human brain and consists of several artificial neurons. Their ability to learn by example makes them very flexible and powerful.

Why Do We Use Neural Networks?

Neural networks have the strength to derive meaning from complicated or imprecise data, and most of the time can be used to detect patterns and trends in the data, which cannot be detectable easily by the human eye or any computer techniques. We also have some of the advantages of NN like Adaptive learning, self-organization, real-time operation, and fault tolerance.

Applications of neural networks

Now a day, in every field NN is equally important, for example, in some of the fields I have listed below: –

  • Sales Forecasting

  • Industrial Process Control

  • Customer Research

  • Data Validation

  • Risk Management

  • Target Marketing

Conclusion:

We can use NN in any type of industry and get benefits, as it is very flexible and also doesn’t require any algorithms. They are regularly used to model parts of living organisms and to investigate the internal mechanisms of the brain.

METHOD-V CROSTON

Introduction:

Its modification of exponential smoothing for sporadic demand product time series was suggested by Croston in 1972. The core value of this method is not only the estimation of average demand volume but also the estimation of time interval length between two non-zero demands, a term called as intermittent demand.

The Croston method works in two steps, First, separate exponential smoothing estimates are made of the average size of demand. Second, the intermittent demands are calculated. This is then used in a form of a constant model to predict future demand.

How Croston’s Work?

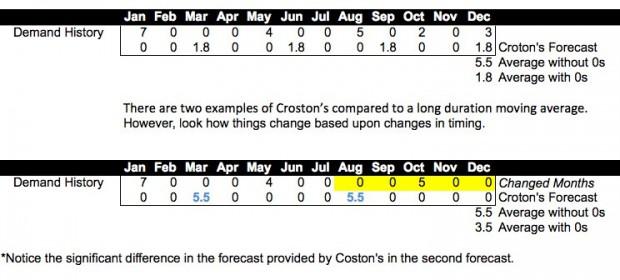
Croston’s has a complex formula, however, the output is very simple. The screenshot below explains what Croston’s does in a very simple way for the sake of understanding.

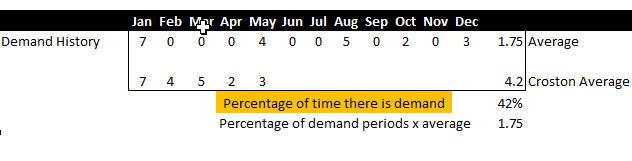
Above is the 12-month average vs. Croston’s vs, while below is the 5-month average vs. Croston’s.

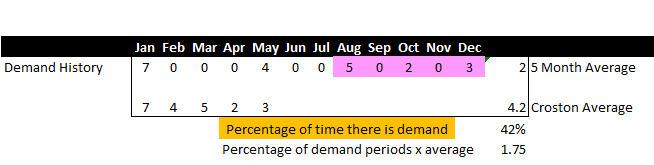
As you can see, Croston removes the periods that have no demand only averaging the periods that have demand. Next Croston calculates the frequency of the demand. The math behind this is complex, but the output is extremely similar to performing exponential smoothing.

Why Do We Use CROSTON?

In the given fig. we have two Croston’s forecasts based on demand histories, with more non-zero data points. Here Croston’s will come into the picture and show its benefits.

  • At the very beginning, Croston starts detecting cyclic and periodicity in the data points of demand patterns. In this case, it is suggested that demand could occur possibly after a 3.5 (4 after roundup) zero period.

  • The second most important thing which Croston does is, adjusts the next occurrence from the last non-zero period if the recent periods are zero periods.

So the objects of the forecast are predicting the consumption at the right moment with the right quantity. Croston does try to predict the “right moment”, which is more sophisticated than the moving average.

Conclusion:

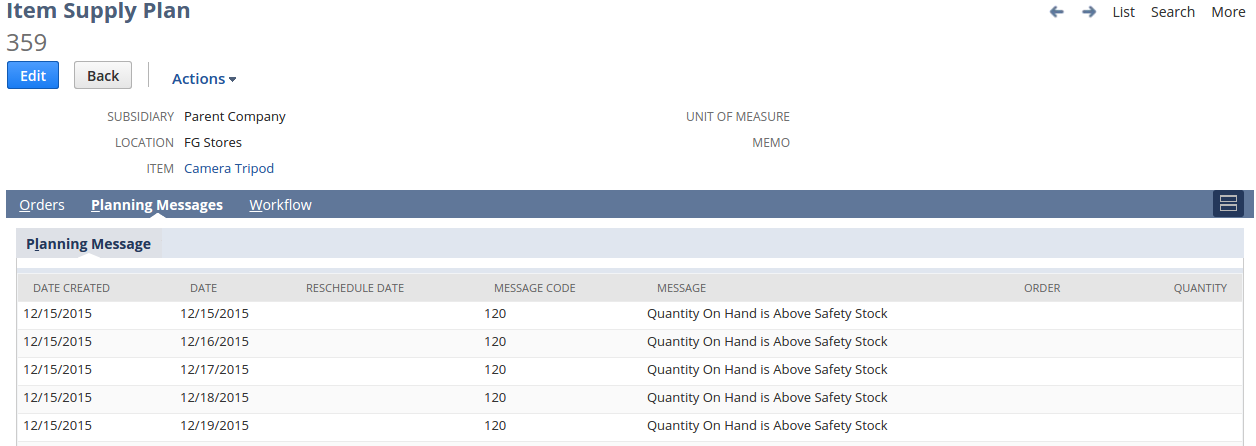
The Croston method is a forecasting strategy for products with intermittent demand. In the univariate forecast profile, choose forecast strategy.

Croston’s can be easily emulated with exponential smoothing and any timing benefit is usually adjusted by order lot sizing, and or safety stock in supply planning. Therefore, demand history must not only be lumpy but must also be very low for Croston’s to be of value. Therefore, Croston’s can be seen as a specialty forecasting method that provides value in certain limited circumstances.

For more information on the Statistical method for forecasting or any such type of implementation, you can simply reach out to us at sales@bistasolutions.com. If you’d like to implement software with forecasting tools for your business, get in touch using our contact form.

Data Selection, Gathering and Preparation for Demand Forecast

Data Selection, Gathering and Preparation for Demand Forecast

Data Selection, Gathering & Preparation for Demand Forecasting

Usually, it’s been observed that the database from where the report is fetched contains a collection of mixed data which includes data used for processing the software, data that contains the configuration values, transactional level data, and so on. So, selecting the right kind of data and gathering it together to give a relevant output on which the next step (i.e. FNS Segmentation) can be applied plays an equal role in better demand forecasting.

Data preparation:

Continuing our previous example, let’s say for demand forecasting for Mint Candies we had to choose all the data available in the backend. Under this condition, for e.g. fields like the name of a salesman who sold these candies and the vehicle information in which it got shipped will be extra information that might not be useful in forecasting the sales for Candies. And also every time a large chunk of data would be synced will result in performance or slowness issues for fetching the data from the report. So, the first thing we need to take care of is about selecting the exact useful data for processing reports.

The next feedback we had it from one of our existing clients who had a common business scenario. Let’s understand it with our example, so now our company has already three existing products i.e. Mint Candies, Bar Chocolates, and Luxury Dark Chocolates. But to progress further, a new product has been launched in the middle of the financial year e.g. Jelly Beans. And by applying the same pattern and FNS Segmentation even Jelly beans started showing their progress in sales. But, at the end of the financial year when we will evaluate all our products than the new product Jelly beans even after making a good sale, it would project low sales at the end of the financial year report. The reason behind this would be an introduction of the new product at mid the year compared to the existing product. So, the next thing we need to take care of is tracking the product from the date it has been introduced in the market or the warehouse.

data-preparation


Seasonality and Trend:

Moving further in the analysis, we got to know that the product has to be tracked in Season wise like during the times of festivals, regular days, etc., and also based on customers’ tastes certain products do well in one part of the country, and at the same time doesn’t go well in the other part. So, we also need to take care that the products have to be tracked in a geographic way as well. There are many measures for tracking like at the Customer level, Market level, Shop wise, and at times at the Hub level as well. Also, if we expand our example horizon-wise for our industry like Chocolates, Soaps Chips, etc. then under this situation it will become necessary to track our products through their categories as well. So that the performance of each line of business can be tracked.

Segmentation:

Last but not the least, it’s like a trend which now a day most of the industry is adopting. It’s about the Segmentation of data, which ideally means dividing the customer into a set of groups based on their buying pattern and lifestyle and then taking any business step by focusing on a certain group of customers. A simple example would be “A group of customer who buys Luxury Dark Chocolates frequently” can be treated as a Platinum group of Customer and to motivate them, more certain discounts or Value Added Services can be provided to them; to keep them engaged with the product sales. So, to continue or to improve product sales, we need to take care of Data Segmentation as well.

We hope our experiences would help in some way in optimizing or directing your business at any given point in time. Like always, we would like to conclude with; if you like any of our advice or suggestion or if you are looking forward to any of such implementations then you can mail us at sales@bistasolutions.com  or contact us here.

How Principal Component Analysis can reduce complexity in demand forecast when you have too many predictors

predictive analytics

Organizations are facing challenges in managing their margins and keeping up with industry growth. Predictive analytics has helped organizations to be ahead of the competition and bring value to their customers. There are many organizations that have used predictive analytics across departments which have helped them increase market share, cut cost, and retain customers while maintaining healthy margins.

One of the most challenging fields in predictive analytics is demand forecast or demand planning. What is the demand for my product in the market and how much inventory do I need to keep in stock to avoid over/under stocking, these are two critical questions organizations must answer today.

The key factor while forecasting demand is to list down variables that are going to impact the forecast. There has been a great demand for macroeconomic forecasts using many predictors to be able to produce accurate forecasts. Whether ignoring or considering all these relevant variables would definitely influence forecasting accuracy and may result in suboptimal forecasts. Therefore statisticians have been developing effective ways to utilize the information available among these predictors to improve the performance of forecasts.

The principal component analysis is one of the methods that identify a smaller number of uncorrelated variables, called “principal components”, from a large set of data. The objective of principal components analysis is to simply obtain a relatively small number of factors that account for most of the variations in a large number of observed variables

Let’s look at an example –

Say we want to analyze customer responses to several characteristics of four types of candies ( Dark, Caramel, Mint, Bar): shape, size, texture, color, packaging, smell, taste, and price. This step is known as product classification (refer picture a)

picturea


We need to determine a smaller number of uncorrelated variables which will help in reducing the complexity while forecasting demand. Principal components analysis will allow us to do that. The results yield the following patterns (refer to picture b):

  • Taste, smell, and texture form a “Candy quality” component.
  • Packaging and shape form a “Desirability” component.
  • Size and price form a “Value” component.

pictureb

This way we can reduce the number of variables and can use these three variables as input for demand forecast analysis that will determine how many candies we will be selling for a particular month/quarter based on historical data. Wants to know more in detail? contact us today!

7 ways Big Data can dramatically change Supply Chain Analytics

7 ways Big Data can dramatically change Supply Chain Analytics

The requirement for managing an efficient supply chain has always been a balancing act between maintaining high service levels and a healthy inventory turnover ratio. There has been numerous studies and research conducted over the years to address the critical issues facing supply chain practitioners. There have also been many software applications and packages which have been custom-built to ensure that “lost-sales” or “stock outs” do not become a sore point in sales review meetings. This has been mostly done at the expense of low inventory turns and overstocking of parts.

The latest developments in big data technology, which is sweeping across many industries and bringing in huge competitive advantages, can be applied equally reliably to address the challenges faced by supply chain professionals. Big data gives the industry an unprecedented power by bridging both structured and unstructured data and presenting information at the practitioner’s fingertips for quick decision making and insights. The following are some major game-changing rules which big data can bring to the practice of Supply Chain analytics.

advanced_analytics

1. Leveraging large Volume of Data: A lot of companies have large volume of historical data running into multiple years, or even decades, in some instances. Hadoop’s distributed storage architecture along with compression technologies like Parquet, Avro and ORC enables efficient storage with very fast access. Thus the huge volume of data, which hitherto was not leveraged to its fullest extent, can now be effectively used for advanced analytics.

Blending_unstructured_data

2. Blending unstructured data for deep intelligence: The availability of NoSQL databases like HBase and Cassandra in the big data landscape enables analytics of unstructured text data which has not been possible until now using legacy Analytics and forecasting packages. This means that information from XML sources for product catalog or web services from suppliers can be integrated in the supply chain decision making process.

advanced_machine_learning_algorithms

3. Advanced analytical models: The Big data community has developed very advanced machine learning algorithms which can be leveraged to used advanced analytical models for forecasting of demand and planning of procurement. Tools like Spark with it’s Machine Learning library (mllib) and R integration in SparkR enable very advanced models to be used on time-series and other data for accurate forecasting and prediction

text_analytics

4. Text analytics: In addition to structured data stored in systems like Hive and semi-structured data stored in HBase, there are numerous tools in the big data toolbox like Elasticsearch and Apache Solr which opens the doors to analyzing text data in various systems. The enormous amount of Textual data can be utilized to gather additional insight about Product feedback, quality and other metrics which can feed into supply chain planning for additional improvements.

ETL

5. External data source blending: External data can add a lot of value to demand forecasting or lead time prediction by leveraging real-time information. The advancement in Big Data technologies enables the supply chain software to respond to our ever changing world in a dynamic manner. Hadoop has been successfully used as an ETL tool to unify such disparate data. The data from such external systems can be used to identify potentially new suppliers with better lead times and prices
agility_in_response

6. Agility in response: Some of the big data components like Oozie, Sqoop, Flume, Kafka and Storm bring the capabilities of doing procurement in real time rather than periodically. These features makes the company’s supply chain more Agile to respond to a spike in demand, a delay in shipment or a sudden requirement in one of the components in a multi-echelon network.
automated_decisions

7. Automated decisions: Gone are the days where supply chain professionals would glean over information in multiple spreadsheets and make procurement decisions. Deep learning systems based on neural networks can now take automated actions based on previously learned data. Moreover these algorithms can get smarter over time by comparing the response against the actual results. If you wish to know more information then get in touch with our team. 

Reasons why do we need to segment and classify product inventory when forecasting demand

ERP System in Inventory Management

Introduction

Inventory management and forecasting demand the products has always been a difficult job especially in the product-driven industry. We had often came across Client who finds more difficulties in proper visibility management and product forecasting and based on the same, making a Purchase and Stocking process becomes inaccurate. Some of the major question arises are:

  1. How many inventories should be maintained for a particular product?
  2. How to forecast sales of a particular product, as the different product has different sales behavior?
  3. How would the inventory be utilized effectively?

At times there’s a demand for Product A but it cannot be purchased or stocked, as the warehouse is already full with other products inventory which is low on demand and had utilized the space in the system. To understand the concept let’s take help of an example i.e. A Fast Moving Consumer Goods Company (FMCG).

Let’s say an FMCG company has some of the products like Mint Candies, Bar Chocolates, and Luxury Dark Chocolates. And the company has an inventory of all their products in equal quantity.


segment_blog_1Graph 1

Diagram 1:

As seen in the above graphs initially if all the three products are kept at the same inventory level, it was observed that Mint Candies were giving more sales then the other two chocolates. So in the ideal situation, according to supply chain fundamentals the decision would be taken is to Increase the inventory of Mint Candies to drive more sales to the Company. But the biggest challenge would be the Luxury Dark Chocolate sales and the space utilized by it which will resist in increasing the inventory of Mint Candies.

So what is the solution?

Bista Solutions had come up with an implementation for one of our esteemed Client by providing FNS Segmentation as a solution which not only helps them in effectively manage their Inventory but also forecasts accurate sales. In this solution, based on the Sales orders history we had segmented the products in 3 categories, i.e.

  1. Fast moving
  2. Normal moving
  3. Slow-moving products

In our example, for better product classification we will associate Mint Candies as Fast moving, Bar Chocolates as Normal moving and Luxury Chocolates as Slow moving. So while stocking the Inventory will give the maximum share to the Fast moving product and least to the Slow moving product. By following this strategy inventory classification would be improved and warehouse utilization with the exact inventory issue will be reduced. Further, post-segmentation analysis it was also observed that the sale pattern of the product i.e. the number quantity sold in per sale order was equally important to be considered. From season to occasion the sale quantity shows a deviation which needs to capture as well for accurate forecasting.

So the same is achieved by determining the Average Demand Interval (ADI) which is calculated as,

segment_blog_3 
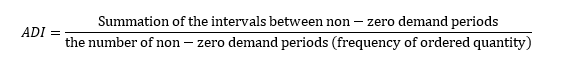
Formula for calculating
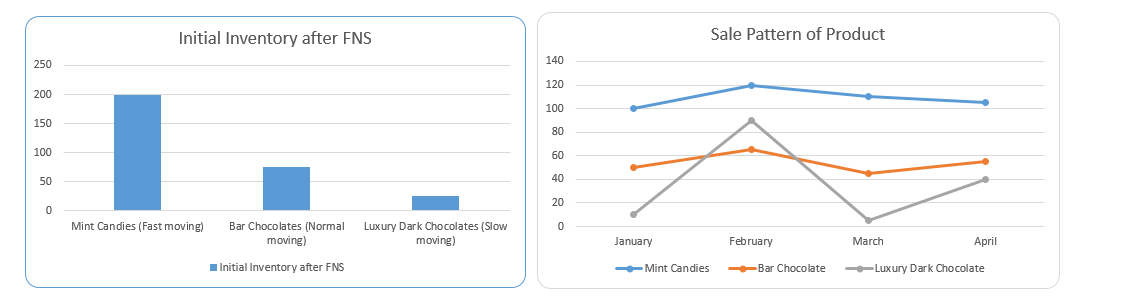
 

With the help of ADI, we further segmented the Products into,

  1. Consistent

  2. Erratic

Now we have products segmentation along with its selling behavior tracked, which means if a product is segmented under Consistent then that product shows almost consistent sales quantity, whereas under Erratic there’s always a drastic difference with inconsistent selling pattern. So now we have final Product segmentation as,

  1. Fast moving – Consistent

  2. Fast moving – Erratic

  3. Normal moving – Consistent

  4. Normal moving – Erratic

  5. Slow moving – Consistent

  6. Slow moving – Erratic

Based on our previous example the new solution would be,

segment_blog_2 Graph 2

The above bar graph represents inventory allocation as per the demand based on the segmentation and fast moving products have got a good amount of share which will definitely add up to the efficient sales performance. The next graph represents the Selling patter or behavior of the products where we can term Mint Candies as Fast moving – Consistent, Bar chocolates as Normal moving – Consistent and Luxury Dark Chocolates as Slow moving – Erratic segmentation.

Hence Segmentation and proper Classification of products help in proper Inventory Optimization, Demand Planning and in getting a decent accuracy while forecasting product demand. With the successful implementation, we are confident that we can bring value to your business as well. If you are looking for similar implementation, you can simply mail us on sales@bistasolutions.com

RODE (Ramco OnDemand ERP) – A BOON, pocket friendly ERP solution.

Ramco On Demand ERP or ERP on Cloud is the right solution for any organization’s enterprise needs because it takes the full power of ERP and places it on the cloud.Most importantly you do not need to put in any investment on new hardware or time on training, or hire any additional IT staff because it is a delivery of application (ERP) via Internet.The automated maintenance and automated upgrade feature in Ramco also free you from the worries of doing these things manually on a regular basis. Additionally, Ramco has simple installation procedure to be followed and can be implemented in a short duration of time, this makes it cost effective also.

Ramco Systems is completely modular and offers a suite of products which are accessible over the Internet. It allows you to fetch any information from any part of the globe just by clicking one button on the browser, be it from any device like a laptop, a PDA, mobile phone or a tablet PC.

Ramco ERP Solutions are made available to the users on the subscription basis as a result of which you choose to scale up or scale down as when required which in turn helps is cost cutting. There is no need to pay any license fees or AMC(Acceptable Means of Compliance).You will be charged according to your usage nothing more than that. provides the full range of enterprise functions by providing a suite of products which are as ERP Software follows – Managing Finance , Aviation ,Manufacturing , Customer Relationship Management(CRM),Human Capital Management(HCM),Supply Chain Management(SCM) , Enterprise Asset Management(EAM) , Aviation M&E/ MRO ,Managing Projects, Process Control Analytics, Advanced Planning & Optimization, and Connectors. Aviation MRO Software can control your functions, plan ahead, manage smarter and deliver the desired results on time. The Enterprise Mobility Solutions is a power pack that provides you with functionalities that will entitle you to attain your potentials, accredit you with best practices in the industry and ensure you to achieve your task with maximum precision.

Enterprise Software is developed on VirtualWorks platform which is based on SOA standards. Enterprise Cloud Solutions provides a consistent, multi-layer architecture that plugin with all technologies and infrastructure platforms, consequently allowing you to incorporate with other portals, devices, and applications. This boosts you with the phenomenal increase in power to collaborate with all your business associates.

Demand Planning & Supply Management in NetSuite

Demand Planning & Supply Management in NetSuite
  • by bista-admin
  • May 11, 2016
  • 0
  • Category:

NetSuite Demand Planning & Supply Management

NetSuite Demand planning capabilities offer robust inventory management. Purchase management & can quickly measure the product demand based on historical data, sales forecasts, trends, and seasonal fluctuations. Demand planning in NetSuite enables you to different stock levels and helps you to streamline tasks.

Key Features of NetSuite Demanding Planning are as below:

  • Calculate demand plans to leverage historical data or sales forecasts.
  • Purchase or Work orders also can be generated automatically by calculating supply plans.
  • Represent how expected purchase and sales orders can influence future inventory levels.
  • Offers real-time visibility into item availability to determine projected ship dates for fulfilling customer orders.

Demand Plan: Flexibility in Forecasting

In NetSuite, your demand plan can be calculated, by selecting the historical data for a particular timeframe or by selecting future forecast data that is used in determining seasonal fluctuations in the inventory. In addition, when generating the demand plan, you can also incorporate preferred stock levels set on a company or a per-item basis. To have the flexibility to accurately project demand in a given area, projections are calculated on a per-location basis. After your demand plan is generated, you can review and edit the individual inventory needs for a particular period of the plan. For Example, you would want to increase the inventory level for June if you plan to run a promotional campaign that month.

NetSuite offers 4 methods of projection to analyze your stock demand:

  • Linear Regression:
    This method is based on Steady Linear Growth (SLG). This means the process uses previous demand to project future inventory needs to be based on SLG.
  • Moving Average:
    This method uses previous demand and calculates the overall average stock level required, it will then projects the future stock levels based on the pre-calculated overall average.
  • Seasonal Average:
    This method uses previous demand to inspect the seasonal trend of inventory flow, it will then project a similar seasonal trend for future stock levels.
  • Sales Forecast:
    When using NetSuite for your sales operations, this method will use forward-looking sales forecast data and then will project the inventory demand.

NetSuite offers a simplified way to create the demand plan for a particular Item for the desired location. Here is an instance of calculating the demand planning for the next 5 months for the Location: Brussels, the Item being: ParkerPen, using the previous 12 months’ historical data. The snapshot also indicates the quantity of the item to be ordered to meet the demand. Monthly Calculated Column shows the Demand forecast of the item whereas the Quantity column shows the actual demand of the Item (Quantity is generated by taking Back-Orders, Levels: Quantity available in Stock, and other such factors into consideration )

item-demand-plan

Supply Plan: Streamlined Replenishment

Once you have created demand plans, you can create individual supply plans for specified items.
For determining your supply plan, The NetSuite Demand Planning gives you a list of suggested
, purchase orders or work orders depending on the parameters set in the item record, say for example ReOrder point and lead time.

If a purchase order is generated, the preferred vendor from the record of that particular item is used on the purchase order and when assembly items are involved, the supply plan factors a work order is generated for the sub-components for all of the build, and if required a purchase order will be generated for the raw material needed in all levels of a multi-part assembly, giving you the flexibility needed for even the most complex of demand planning environments. Additionally, the supply plan enables you to select which items to automatically calculate ordering requirements, providing flexibility when different methods might be required.

Generated Supply Plan Can have the Following 2 Cases.

Case 1: When the forecast of an Item meets with the Available Quantity of that Item
(A message is Generated Showing “Quantity On Hand is Above Safety Stock”)

item-supply-plan

Case 2: When the forecast of an Item do not meet the Available Quantity of that Item
(PO/WO is Recommended or Generated)

item-supply-plan-2

Gross Requirement Inquiry: Modeling InLevels:

NetSuite Demand Planning also provides inquiry, which allows you to represent how expected sales and purchase orders will influence future inventory levels. This feature is crucial while ensuring that you can represent different aspects of your business and analyze the impacts.

NetSuite provides the best class of inventory management feature, that is it maintains the correct amount of inventory to effectively meet anticipated demand and maintains the delicate balance of the “right” inventory. This eliminates the danger of investing too much capital in excess inventory or having too little inventory and minimizes the risk of failed sales or customer dissatisfaction because of the non-availability of stock.

gross-requirement-inquiry

The inquiry displays data retrieved from your account regarding all events that change the stock level of the selected item. The inquiry results show the date on which the Item is receipted from the supplier or the shipping date, the date of Order, the type of action by which the inventory level is affected, and the Quantity.

Generating reports for demand planning is very easy within NetSuite.
Here’s what one of the reports looks like:

We Hope the article helps the Netsuite users with Demand Planning and Supply Management modules.

For assistance with implementing NetSuite or other ERP software, get in touch! You can reach us using our contact form or email us at sales@bistasolutions.com.

Automated versus Manual Testing

Automated versus Manual Testing

Software Testing can be done in both Automation and Manual testing method, however which testing method to adapt totally depends on the what are the requirements of the project, what is the budget of the project, and which testing method will be best suited for that particular project.

Let’s get into the details of the two testing methodologies to understand which one to adapt in which situation

What defines an Automated Testing ?

Automated testing is the process in which a software (tool) is used to run tests that perform repeated and predefined actions, comparing the expected and actual outcomes of the application under test.

Pros of Automated Testing:

1. Runs tests quickly and effectively

No wonder Tools can be faster in Test execution than human users.Although the test design process in automation testing may take more time than in manual testing the former still has an advantage over manual testing.Testers only have to generate test scripts using test tool and script features . Test tools can execute the test scripts either one by one or a series of scripts simultaneously. Test Scripts can be reused on different versions of software. Test scripts can also be repeated with multiple sets of test data without user interaction.

2. Can be cost effective

Automation tools are expensive but they save your money in the long run. They not only do more than a human can in a given span of time but they also find defects quicker than humans. This allows QA team to react more quickly by saving both precious time and money.

Cons of Automated Testing:

1. Tools have limitations

While an automated test debugs your system quickly,saves time and money there are also some limitations to it. Automated tools cannot test for visual considerations like image colour or font size. Changes in these can only be detected by manual testing, this implies that not all testing can be done with automatic tools.

2. Automated checks can fail due to many factors.

If the application under test repeatedly fails due to some issues (except for genuine bugs), they automated checks can raise false alarms. Also automated tests can fails even when a minor UI change is implemented, or there are network issues which are may not be concerned to the application under test, but do affect the automated checks,or even a service is running down.

What defines Manual Testing ?

Manual Testing is a process in which manually testing is carried out on the application by testers in order to find flaws and defects .Manual testing requires a human (Tester) to act like a end user of the application and test all the features of the application to ensure the application behaves accordingly.

Pros of Manual Testing:

  • Manual testing is cost-efficient for tests that run only for a few times.

  • Manual testing of UIs is most effectively done by humans.

  • Only a human tester can test a software’s UX properly.

Cons of Manual Testing:

  • Manual testing does not support Load testing and performance testing.

  • Running test cases manually is very time consuming job.

  • In Manual testing, Regression Test cases are time consuming.

Evaluating and Selecting the Right BI Analytics Tool

BI Analytics Tool

A powerful process for evaluation and selection of the right Business Intelligence analytics tool starts from collecting and rank BI requirements, then proceeding further to utilizing business use cases to decide on the right tool category and style.

Your company can choose the analytics tool that suits your scenarios and use cases, fits well into your budget and can be easily implemented and integrated into the technology perspective. An important measure in the evaluation of Analytics tools is to understand and realise which of the features and functions are must-haves, nice-to-haves, and will-not-use.

1) Must-haves: This classification should be clear and explicit. If the product doesn’t have a particular feature or function that your scenario requires, it’s excluded from further consideration.Typical must-have features are like:  connection and access to various databases and file types, cleaning,arranging and filtering data, drilling down from outlined to more elaborated data, a Web-based client-user interface, print and export, visualizations techniques and safety and privacy of data.

2) Nice-to-haves: As the name goes “nice-to-have” these are the features that aren’t required, but they are usually the differentiators in selecting a product.They are like add-on’s and toppings.

3) Will-not-use: Some analytics tools can have a big list of features which your organisation might never need. For such cases, do not waste time checking those aspects of tools during the evaluation and selection process.

Qualities of a Good Agile Leader

Agile method of development

The agile method of development has been in practice for quite a lot of years and has now become the standard for most of all tech companies. But why is it that some organizations still struggle in Agile, While some others are big hits? Sometimes it’s really worse when a few teams assume they are Agile only because they practice agile concepts like frequent stand-ups and ex-post facto, but are miles away from being Agile in reality.

The agile method of development has been in practice for quite a lot of years and has now become the standard for most of all tech companies. But why is it that some organizations still struggle in Agile, While some others are big hits? Sometimes it’s really worse when a few teams assume they are Agile only because they practice agile concepts like frequent stand-ups and ex-post facto, but are miles away from being Agile in reality.

The agile method of development has been in practice for quite a lot of years and has now become the standard for most of all tech companies. But why is it that some organizations still struggle in Agile, While some others are big hits? Sometimes it’s really worse when a few teams assume they are Agile only because they practice agile concepts like frequent stand-ups and ex-post facto, but are miles away from being Agile in reality.

These differences are believed to be because of the leaders, from the Scrum Master, to the Delivery Manager or to the CTO all those who have the power/responsibility to lay down the foundations of an agile working culture in the organization.

So what qualities define a Successful Agile leader?

1. An Agile Leader should make sure that the aims and goals of the organization are clearly understood by everyone individual under consideration in the delivery of the project, this involves the customers or the scrum teams and stakeholders.
2. A leader is required to have Strong communication skills viz – storytelling capabilities and should be a good listener.
3. Passionate about learning new things and has an intense curiosity about the unknowns.
4. He/she is calculated risk taker.
5. Focused strongly on his/her priorities.
6. He/she is open to criticisms and takes it in the most positive way.
7. A good agile leader is responsible for creating an environment where small failures occur early and often during the development life cycle, and hence lowering down the danger of a huge failure occurrence at the end of the project.
8. He/she will make sure that the team is dedicated, focused and tuned to the individual work rather than multitasking.
9. A good agile leader will put in his cent percent so that the team delivers a high-quality product on time.
10. He/she should make the current and goal situation clear so that people can think and act autonomously.
11. The leader is expected to have a Positive attitude and an innate ability to be diplomatic in any circumstances.
12. The leader should place his faith in the capability of his/her teams, giving them real empowerment.
13. The Agile leader will not be afraid to show some vulnerableness.
14. The leaders work should be such that he/she inspires and motivates others.
15. The leader must be approachable and outgoing and open to suggestions even from his younger teammates.