Spend less time on ETL and more time on analytics using Data Blending

Introduction

Bista Solutions had always been ahead in terms of adopting new technology and ongoing trend especially in the BI industry. For projects having short deadlines and Customer who don’t prefer spending more on the ETL part, we at Bista solutions had opted for Data Blending option for such special customers. After the successful implementation for one of our esteemed Client, we would like to share our experiences in using Data Blending.

Before we start, let’s understand what exactly Data Blending refers to? Data Blending is basically a process of combining the data from multiple data sources into a proper useful data set which can be used efficiently for reporting and analytics.

Challenges faced:

So as per our Customer requirement, the core data was required to be fetched from Postgresql and since they wanted to capture daily Currency rate fluctuations so we had to also fetch data from their website and to record their historic data it was also required to connect to the Hive database. As a part of the visualization, all this data from different sources had to be analysed and used in a single report. So, under this scenario, we initially opted for ETL to combine all three sources of data and point to a single data set. But it was difficult to implement due to time constraint and budget cost.

Solution provided:

To provide a better solution we had to explore and implement the Data Blending option which not only helped us in saving time but also made us to deliver the product on time without compromising on the quality. Tools which really helped us in implementing the same in our multiple projects were

  1. Tableau
  2. Microsoft Power BI

As per our experience on this tools, they were helpful in implementing the Data Blending concept for our Clients. The flexibility of self-service BI along with data blending facility gives a completely new edge in implementing a powerful BI solution.

Let’s understand why we didn’t preferred joins over Data blending.

  • Data needs cleaning.

On the off chance that your tables don’t correspond with each other effectively after a join, set up information hotspots for every table, make any vital customizations (that is, rename segments, change segment information sorts, make bunches, utilize figurines, and so on.), and afterward utilize information mixing to consolidate the information.

  • Joins cause copy information.

Duplicate information after a join is a side effect of information at various levels of detail. On the off chance that you see duplicate information, rather than making a join, utilize information mixing to mix on a typical measurement.

  • You have loads of information.

Commonly joins are prescribed for consolidating information from a similar database. Joins are taken care of by the database, which permits joins to influence a portion of the database’s local capacities. In any case, in case you’re working with extensive arrangements of information, joins can put a strain on the database and essentially influence execution. For this situation, information mixing may offer assistance. Since Tableau handles joining the information after the information is collected, there is less information to consolidate. At the point when there is less information to consolidate, by and large, execution moves forward.

Note: When you mix on a field with an abnormal state of granularity, for instance, date rather than a year, questions can be moderate.

Also during implementation, we came across some Prerequisite like,

Your data must meet the following requirements for you to use data blending.

Primary and secondary data sources

Data Blending requires an essential information source and no less than one optional information source. When you assign an essential information source, it works as the primary table or principle information source. Any consequent information sources that you use on the sheet are dealt with as an auxiliary information source. Just segments from the optional information source that have relating matches in the essential information source show up in the view.

Utilizing a similar case from above, you assign the value-based information as the essential information source and the quantity information as the auxiliary information source.

Note: Cube (multidimensional) information sources must be utilized as the essential information source. 3D shape information sources can’t be utilized as an auxiliary information source.

Characterized relationship between the essential and optional information sources

In the wake of assigning essential and optional information sources, you should characterize the basic measurement or measurements between the two information sources. This normal measurement is known as the connecting field.

Proceeding with the case from above, when you mix value-based and amount information, the date field may be the connecting field between the essential and auxiliary information sources.

  • If the date field in the essential and optional information sources have a similar name, Tableau makes the relationship between the two fields and demonstrates a connection symbol ( ) beside the date field in the auxiliary information source when the field is in the view.
  • If the two measurements don’t have a similar name, you can characterize a relationship that makes the right mapping between the date fields in the essential and auxiliary information sources.

Benefits:

With the help of Data Blending our BI solution offered flexibility to connect to multiple data sources and visualize it under the same report which not only made it more attractive but also helped in a productive way for our Customer which was missing before in their existing system. So now our customer could visualize their historic data and the value of the same under certain Currency exchange daily. Last but not the least it helped us in budgeting project cost up to 20% which was allocated for the ETL process. With this implementation, we strongly recommend our Clients for Data Blending and well confident to implement and bring value to your business data as well. If you are looking for any such type of Implementation or require any further details on the same, you can reach out to us on sales@bistasolutions.com , Also if you have any feedback or suggestion then mail us at feedback@bistasolutions.com    

Statistical Outliers: Detection and Treatment

Statistical outliers

Most real-world datasets include a certain amount of anomalous values, generally termed as ‘outliers’. These observations substantially deviate from the general trend therefore, it is important to isolate these outliers for improving the quality of original data and reducing the adverse impact they have in the process of analyzing datasets. Practically, nearly all experimental data samples are likely to be contamination by outliers which reduce the efficiency, and reliability of statistical methods. Outliers are analyzed to see if their unusual behavior can be explained. Sometimes outliers have “bad” values occurring as a result of unusual but explainable events. The cause of outliers are not always random or chance. Therefore a study needs to be made before an outlier is discarded.

Detection of Statistical Outliers

Statistical outliers are more common in distributions that do not follow the normal distribution. For example, in a distribution with a long tail, the presence of statistical outliers is more common than in the case of a normal distribution.

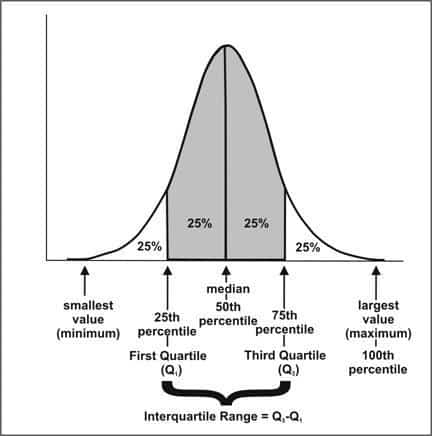
The simplest method of identifying whether an extreme value is an outlier is by using the interquartile range. The IQR tells us how spread out the middle half of our data set is.

The interquartile range, or IQR, is determined by subtracting the first quartile from the third quartile.

interquatile range

We start with the IQR and multiply it by 1.5. Then subtract this number from the first quartile and add this number to the third quartile. These two numbers from our inner fence. For the outer fences, we start with the IQR and multiply it by 3. We then subtract this number from the first quartile and add it to the third quartile. These two numbers are our outer fences.

Statistical outliers

Outliers can now be detected by determining where the observation lies in reference to the inner and outer fences. If a single observation is more extreme than either of our outer fences, then it is an outlier, and more particularly referred to as a strong outlier. If our data value is between corresponding inner and outer fences, then this value is a suspected outlier or a weak outlier.

Example

Suppose that we have calculated the first and third quartile of our data, and have found these values to be 40 and 50, respectively. The interquartile range IQR = 50 – 40 = 10. Next, we see that 1.5 x IQR = 15. This means that the inner fences are at 40 – 15 = 25 and 50 + 15 = 65. This is 1.5 x IQR less that the first quartile, and more than the third quartile.

We now calculate 3 x IQR, that is, 3 x 10 = 30. The outer fences are 3 x IQR more extreme that the first and third quartiles. This means that the outer fences are 40 – 30 = 10 and 50 + 30 = 80.

Any data values that are less than 10 or greater than 80, are considered outliers. Any data values that are between 10 and 25 or between 65 and 80 are suspected outliers.

Reasons for Identifying Outliers

The presence of outliers indicates errors in measurement or the occurrence of an unexpected and previously unknown phenomenon. It is extremely important to check for outliers in every statistical analysis as they have an impact on all the descriptive statistics, as they are sensitive to them. The mean, standard deviation and correlation coefficient in paired data are just a few of these types of statistics. This could mislead analysts into making incorrect insights as all these statistics get distorted.

NOTE:

Certain statistical estimators are able to deal with statistical outliers and are robust, while others cannot deal with them. A typical example is the case of a median. It is the most resistant statistic with a breakdown point of 50%. Which means that as long as no more than half the data are contaminated or missing, the median will not deviate by an arbitrarily large or small amount.

In practice, an outlier could cause severe damage to data-driven businesses. For example, outliers in transactional data of retailers or distributors could lead to the incorrect calculation of demand forecasts. Leading to a mismatch of demand and supply as the business either ends up understocking and overstocking its inventory. Other adverse outcomes could also include; inaccurate budget planning, non-optimum resource deployment, poor vendor selection, loss-making pricing model et cetera.

Even engineering firms or manufacturers can be adversely affected by outliers. Errors in measurement taken from sensors (eg. thermometers, barometers) during quality checks of the products produced, could result in unexpected failure of products, incorrect measurement of warranty periods, initiate re-designing of products et cetera.

The adverse effects of outliers could even influence the life of citizens when data collected by the government contains outliers. Biased samples in government surveys, containing observations which would’ve been considered outliers when compared to the entire population, could justify the formulation of policies that could damage society. Thus, it is imperative to devise methods of dealing with outliers in statistical analysis.

Treatment of Outliers

The treatment of outlier values can be achieved by the following categories of actions that can be taken:

  1. Transformation of Data: Transformation data is one way to soften the impact of outliers since the most commonly used expressions, square root and logarithms, affect larger numbers to a much greater extent than they do the smaller ones. Transformations may not fit into the theory of the model all the time as they may affect its interpretation. Transforming a variable does more than make a distribution less skewed; it changes the relationship between the variables in the model.

  2. Deletion of Values: When there are legitimate errors and cannot be corrected, or lie so far outside the range of the data that they distort statistical inferences the outliers should be deleted. When in doubt, we can report model results both with and without outliers to see how much they change. Data transformation and deletion are important tools, but they should not be viewed as an all-out for distributional problems associated with outliers. Transformations and/or outlier elimination should be an informed choice, not a routine task. In some cases, the removal of an outlier value can also induce incorrect inferences made about the data. In such cases, replacing the observation with a measure of central tendency (Mean, Median or Mode), depending on the situation.

  3. Accommodation of Values: One very effective plan is to use methods that are robust in the presence of outliers. Nonparametric statistical methods fit into this category and should be more widely applied to continuous or interval data. When outliers are not a problem, simulation studies have indicated their ability to detect significant differences is only slightly smaller than corresponding parametric methods. There are also various forms of robust regression models and computer-intensive approaches that deserve further consideration.

If you’d like to implement software involving forecasting for your business, you can reach out to us using our contact form or at sales@bistasolutions.com.

Odoo Request for Quotation Merge App

Odoo-Request-for-Quotation-Merge-App-bista
  • by bista-admin
  • Jan 09, 2017
  • 0
  • Category:

Introduction:

Odoo 10 is the most revolutionary ERP present in the market with its amazing features and user-friendly interface. With the help of the odoo team, partners, and all contributors worldwide odoo has evolved at a very high pace.

Odoo Apps:

There are various apps in odoo both for community and enterprise editions related to manufacturing, e-commerce, accounting, sales, purchases, etc. These apps are divided into the category of free/paid ones.

Request For Quotation Merge App:

For odoo community and enterprise versions, this app supports combining or merging requests for quotation documents. When we have multiple quotations for the same vendor it can be useful to merge them all into one before creating a purchase order and sending it. A new request for quotation with a new reference is generated and the originals are canceled. Merging works if multiple vendors and quotations are selected. If multiple vendors are selected, one merged quotation per vendor will be created.

How does Quotation Merge App Work?

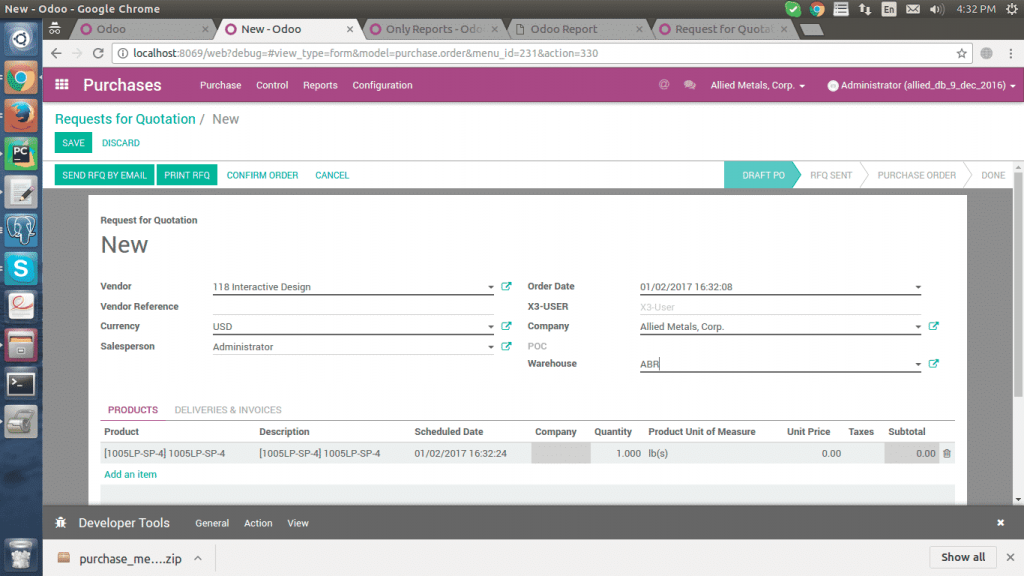
Step 1: Create one request for quotation:

For example: In the below screenshot we could see a request for quotation is created with currency and warehouse location to be filled as mandatory.

purchases

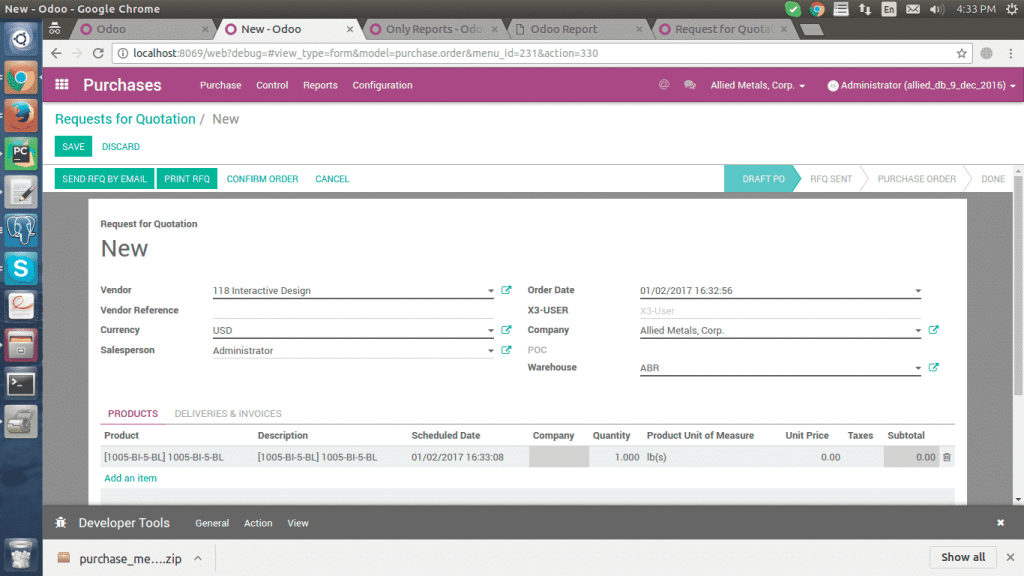
Step 2: Create a second request for quotation:

Considering the same vendor name, currency, and stock location another quotation is created

Create second request for quotation

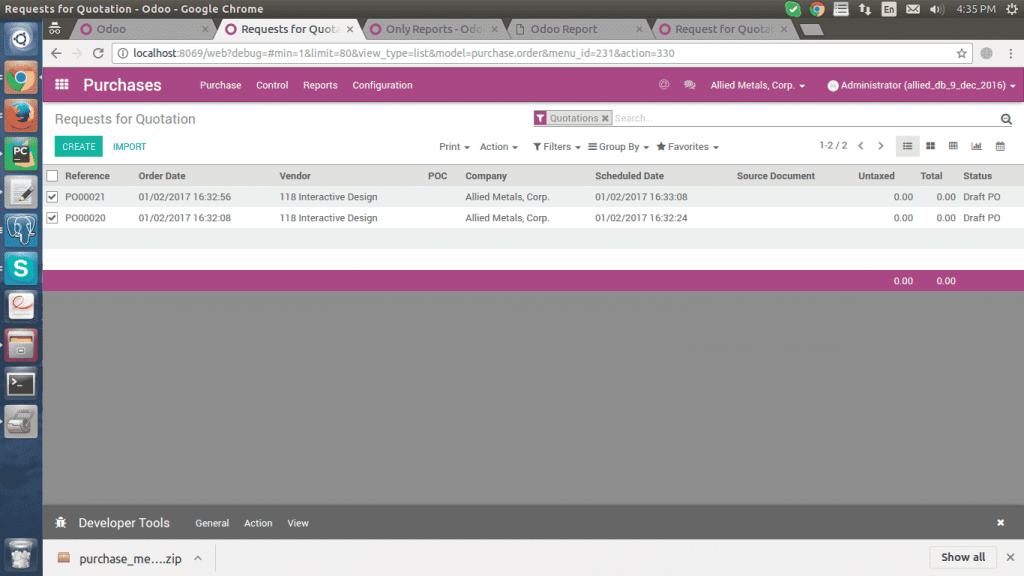
Step 3: Select and Merge Quotations:

After the creation of quotations select both of them from ‘Treeview’ following the below navigation

Action –> Merge Request for Quotation

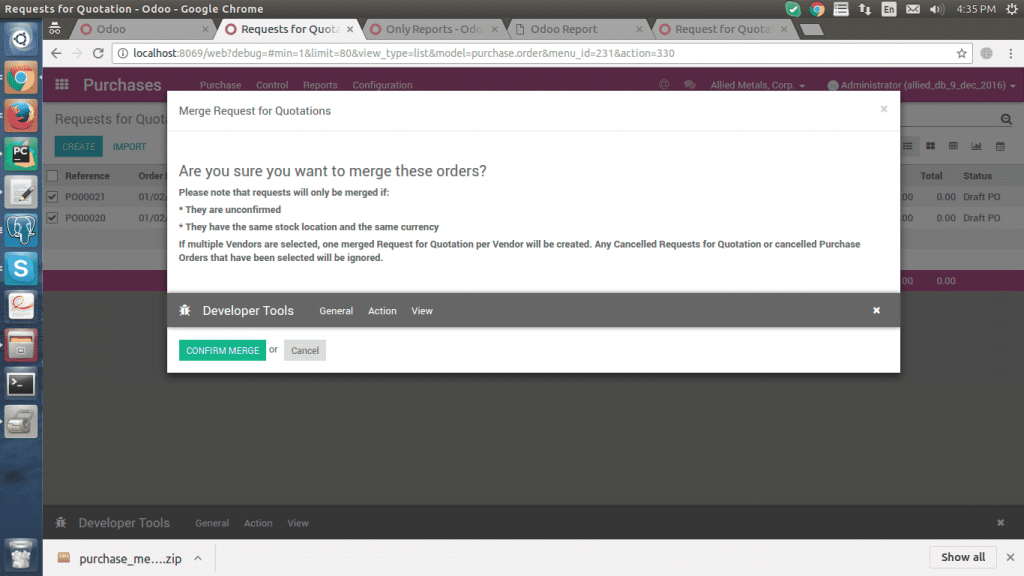
A pop-up window will appear in which we need to check whether the conditions are followed or not unless merging could not be done

Select and Merge Quotations 1 Select and Merge Quotations 2

Result:

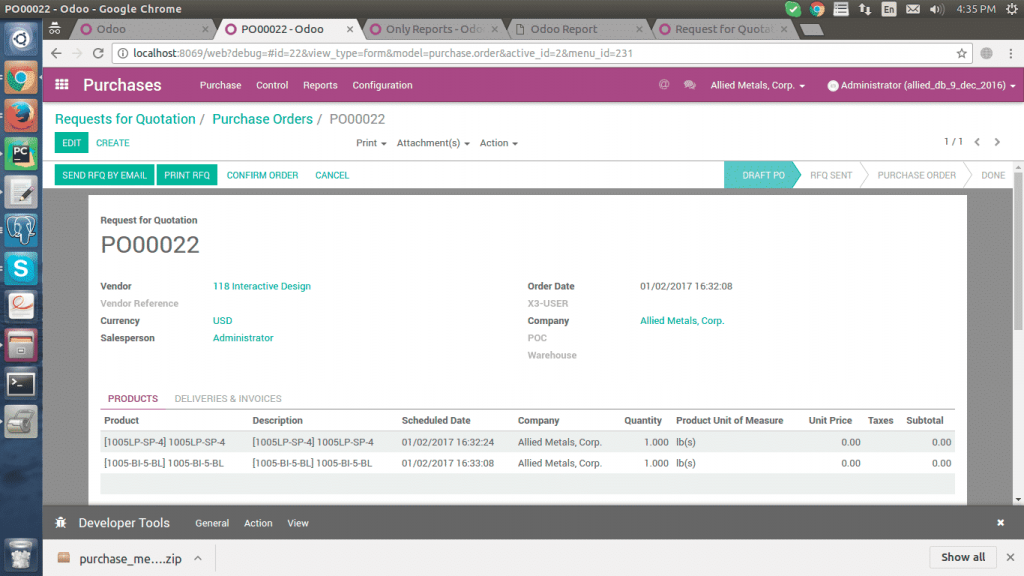
As the conditions are followed so simply click on the ‘Confirm Merge ‘ button and customers will see that a new purchase order with a new reference number has been generated which includes the merging of both quotations.

result

This was all about the ‘Odoo Request For Quotation Merge App’.We hope this snippet of the Quotation Merge App helps you to get some insights into odoo. Stay tuned for more information on odoo.

Please feel free to reach us at sales@bistasolutions.com for any queries on od0o and its related modules. Also, you can write us through

feedback@bistasolutions.com and tell us how this information has helped you.

Top 5 Big Data Trends 2017

big data
  • by bista-admin
  • Jan 06, 2017
  • 0
  • Category:

2016 was a landmark year for big data with more and more organizations switching to big data for storing, processing, and extracting value from data. In 2017, systems that support large volumes of both structured and unstructured data will continue to rise.

1.Big Data becomes Faster and Easier.

With all the buzz that has been surrounding Big Data and Hadoop technology over the major advantages they have which includes performing sentiment analysis and machine learning with the support of AI, Hadoop still had certain shortcoming which was the ability to support interactive SQL. SQL has of course been the means through which business users access Hadoop faster for exploratory analysis. This need for SQL fueled the adoption of faster databases like MemSQL and Cassandra, Hadoop-based stores like Kudu. With these boosters, Hadoop will now become as powerful as traditional warehouses with respect to use of SQL and advanced analytics

2.Big Data will grow more than just Hadoop in 2017.

With growing need of organizations to access data from various sources ranging from cloud warehouses, to structured and unstructured data sources, Big data will no more remain just with Hadoop. Businesses that rely only on Hadoop will have to use a variety of tools and infrastructures to perform advanced analysis and find answers to some critical questions. They will need data preparation tools, data cleansing tools, predictive analysis and various other analytical algorithms and so on so forth.

The Apache Spark, although it is in its primitive stages it has by far evolved to be a complete package to meet all these requirements.Apache Spark has a unique in-memory capability that supports a wide variety of data processing workloads.This in-memory storage enables applications low latency computation and to implement efficient iterative algorithms. In 2017 Customers will demand analytics and insights of all sizes and types of data. And so only those platforms which are capable of evolving to fulfill these needs will rise and continue to grow with Big Data.

3. Hadoop will no longer be just a batch-processing platform for Data Science.

Hadoop has now become a multi-purpose engine to perform ad hoc reporting. Hadoop can also perform operational reporting on day-to-day workloads which were earlier looked after by traditionally data warehouses. In the years to come, Hadoop will conquer all its shortcomings and be equal in power to probably be able to replace the existing and age-old techniques of reporting with an extremely easy user interface and self-service BI capabilities. Hadoop will create new opportunities for self-service analytics. In the years to come everything will become sensor controlled and everything will have its convergence from IoT which generates massive amount of structured and unstructured data which will be deployed and stored over cloud, as a result of which Big Data and Hadoop tools will have to fasten their speed to meet the growing demands for analytical tools that seamlessly connect to and combine a wide variety of cloud-hosted data sources.

4. Deep Learning Algorithms will Add Value to Big Data

Big Data can get even more valuable in the years to come if Deep Learning Algorithms continue to grow the way they are right now. Already Deep Learning Algorithms have the capabilities to recognize patterns in the video, audio, speech, image and other non-textual data. Well having said this there is a lot more that Deep Learning Algorithms can do! It will be no wonder if one day along with recognizing the image or objects these algorithms will be able to understand what is happening in the image or video and probably be able to have a human-like brain to analyze and take actions according to the situations.

5. Last but not the Least “The BlockChain Technology promises”

Have you all wondered where does Big Data come from? And Can this data be trusted? And how do we ensure that this Big Data is not a Big Bad Data? With the amount of data that is being generated from heterogeneous sources and the rate at which it is being generated the probability of this data being erroneous has also gone up to great extent. So what can we do to ensure that this powerful capability? We have to aggregate terabytes of data is, in fact, producing correct big data? It would be so nice if we never had bad data entering our databases. All these possibilities can come true if BlockChain Technologies stands by its promises.

Today, as a matter of fact, we all know that the Internet is a global repository of information but the need of the hour is that we need a global and a secure ledger of truth. A ledger that is not corruptible by any human fraud or is not subjected to any manipulation by any group, corporation, company, or even government for that matter. And this ledger is BlockChain Technology.

Blockchain Technology will basically help all industry where digital transactions are involved, this ranges from the financial industry to the legal industry to the real estate to the notaries, to gambling or even to publishing to data storages. In 2017 there will be a wider adoption of the blockchain technologies as most of the banks have already started investing and experimenting blockchain technology to ensure secure transactions.

Well, we hope this snippet of some predictions of Big Data Trends in 2017. It help your organization to invest in right things at the right time and be up front in this race of emerging trends and technologies. Stay tuned for more insights on Big Data and its related ecosystem at BistaSolutions.com.You can also get in touch with us through sales@bistasolutions.com and write to us at feedback@bistasolutions.com.

Why Investing in Big Data is the new competitive advantage

Big Data

Advantages of Big Data

Big Data has now become the new thing that will make a few companies leapfrog the others to become the best in class service provider in the market. Data is now prone to be generated by every sector of the global economy, In Fact, data has become such a vital factor that like other essential factors of production which include hard assets and human capital, much of the modern economic activity cannot take place without data.

In the current business environment, that is affected by proliferating data, dwindling budgets and developing customer demands, companies that make the right decisions at the right time have a competitive advantage. The ability of the companies to obtaining actionable insights will leverage the amounts of data that floods into the organization of all variety. Big data analytics provides the insights that help businesses make more informed decisions by using a combination of past data, responding to current business needs in real-time, and predictive modeling to design a roadmap for future growth.

In this article Bista Solutions will explain what are the advantages that come with Big Data and Analytics:

  • Big Data can unlock significant value by making information transparent. Leveraging big data can enable businesses of all kinds to make large volumes of information transparent and usable.

  • Organizations can generate and maintain more and more transactional data in digital form. Organizations can collect more accurate information on every minute thing ranging from inventory tracking to sick leaves and therefore expose variability and boost performance.

  • It enables companies to get accurate insights which imply better decision making and minimized risk.

  • It can be used to develop the next generation of products and services. Big Data Analytics can also be a great help to glean essential information that determines product and service improvements.

  • Big Data is secure. In a survey conducted amongst the companies leveraging big data. It was found that the secure infrastructures that are built on big data platforms will save company’s 1.6% of the annual revenues which were earlier spent on recovering the data breach issues.

  • A particular challenge arises with organizations that need to process and exploit unstructured data. This challenge is taken care of with some big data tools, specifically those that are based on Hadoop and are designed from the ground up to manage and analyze unstructured information. This would otherwise not be accomplished with some of the most conventional business intelligence (BI) and data warehousing tools as well.

Organizations that invest in big data will witness that returns on these investments will deliver over a period of time. Better business decisions mean that companies can reduce the risk of their decisions and this will lead to reduced costs and hence increases the marketing and sales effectiveness.

The success of a company not only depend on the company is performing and how it is being looked after but also depends on various other social and economic factors. The predictive analysis that is fuelled by Big Data technologies can help the organizations to scan and analyze newspaper reports or social media feeds so that you can always be up to date on the latest developments in your industry. Big Data also helps you to understand what others perceive of your products so that you can adapt them, or your marketing if need be.

Making ERP implementation a Success using Change Management

Making-ERP-implementation-a-Success-using-Change-Management
  1. Odoo development firms should have a good change management process in place to handle the entire cycle of Change Management since Change Management is very vital for Business suite Applications due to complexity & mapping of business processes in different departments & business operations
  2. Odoo development firms should define a unique way of change management process due to agility requirements for business operations and every changing business environment due to stringent competition in different business domains. Firms have to be up on sleeve for the ERP implementation with well-defined set of ERP features & change management is one part which has to be carefully drafted into ERP management & ERP Implementation
  3. ERP Implementation has a greater stakeholder impact considering its management and its application in different business domains since every stakeholder has his own department to look after and the Business suite application should satisfy the needs of the department in a straightforward manner
  4. ERP features require change management for process enforcement and to have processes define the change & control its impact to the business operations in such a way that it is crafted in a lenient manner to handle the process flow with multiple data points linked and handled precisely.
  5. Change management plays a very important role in the ERP environment with its purpose of managing the ERP features & a complete ERP management & ERP Implementation

Is Your Legacy ERP System Costing You Innovation?

ERP system

ERP Systems

When question for Upgrading your ERP system arises, there are some common answers stating “Just patched, fixed or tinkered with it” instead of which it can be

Yes, Implemented upgrade with real Business Innovation.”

From our observation, Due to limitations and headaches that come with legacy, On-premise ERP systems are becoming vanished every day. The key to knowing how aligned your ERP systems are with your business imperatives is measuring how much of the IT budget is devoted to innovation rather than maintenance.

Initially, old ERP was designed when IT was constrained.They helped far-flung and disjointed firms finally co-ordinate activities.Yet, these products were always doomed to obsolescence. Organizations that have already invested heavily in on-premise ERP are hesitating to rip it out and replace it. Broken customizations and workflows have many companies on software versions that generations old.How can businesses held back by their legacy ERP, reluctant to even upgrade their systems, compete in today’s fast-moving business environment? Companies are stuck doing patches, fixes and managing infrastructure rather which it should be investing IT resources and Innovations.

NetSuite

NetSuite provides the engine to excel growth, enabling businesses to lay down an application footprint for each country and subsidiary in the just week in spite months and years. Cloud ERP spares businesses from having to worry about scaling up expensive IT resources and spending large capital expenditures on IT infrastructure. The result is creating true competitive advantage.

NetSuite, the world’s #1 cloud finance/ERP solution used by more than 30,000

Organizations all over the world is the right move for your business.

NetSuite works the way your business works reducing the hassle for IT.

Providing complete visibility, simplified integration and Industry-specific support for a broad range of industries with Comprehensive functionality. NetSuite also gives the broad range of robust ERP and global financial functionality, Powerful development platform, Built-in business intelligence, Commerce-ready capabilities for both B2B and B2C. Being a Netsuite partner and after implementing many projects in the same, we are confident to bring change to your business with robust Cloud ERP solution i.e. Netsuite. If you are looking for any such implementation, you can mail us at sales@bistasolutions.com and for any feedback or concern, u can write back to us on feedback@bistasolutions.com.

Account Payment Balance App

Introduction

Odoo v10 is the most revolutionary ERP present in the market with its awesome features and user-friendly interface.With the help of Odoo team, partners and all the contributors worldwide odoo has evolved at a very high pace.

Odoo V10 Accounting

Odoo accounting is an app which is designed as per the needs of users and customers.It connects directly to the bank and payable accounts. Odoo accounting is well integrated with all other apps such as sales, purchase, and inventory.

Account payment balance app

This is a new app developed by Bista Solutions.This app allows the user to easily select or find the payments which are not used/reconciled yet or which are partially used.

Previously customer had to go to payment option individually and then they could check regarding reconciled amount through invoices.To avoid this problem one field is added in payment tree view called “Unapplied Balances” through which we customers can directly see over there regarding how and where the amount is used or reconciled.

Let us understand by taking a simple example:

Suppose that one of your customers sent you advance payment in 3 partitions

1.1000$

2.3000$

3.6000$

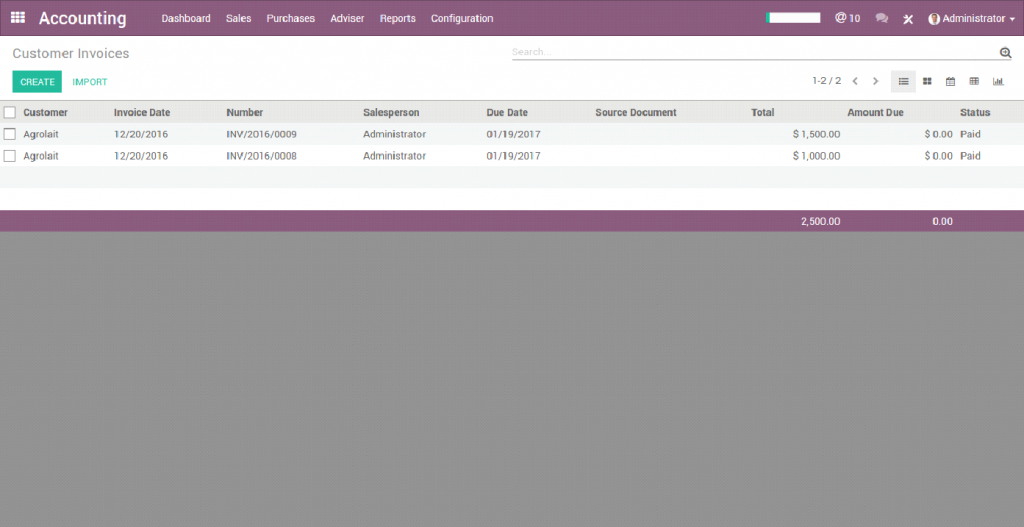
After sometime, he added 2 more orders; one costing 1500$ and another one 1000$ and out of the 3 payments; 2nd and 3rd payments are used.

Here are some screenshots which show the invoice order generated by the customer.

customer invoice

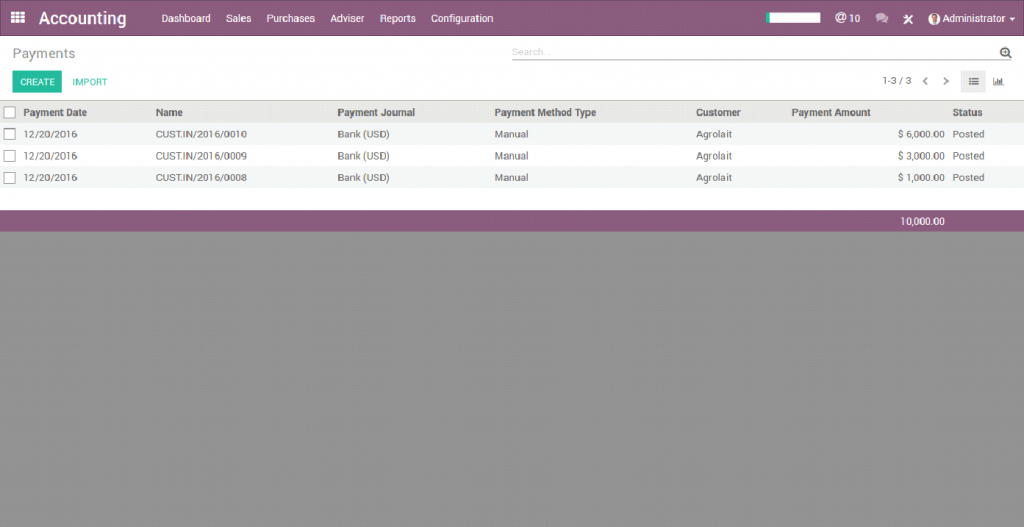
Now if users try to check in the system via payment review, he will never be able to find which payment is used/reconciled for the above order invoices ,then the user has to go to each and every payment created for above customer to check out the payment balance that how much amount is used.

accounting payments

To solve this issue, a field named “Unapplied Balances” is added in this new app through which the user would easily identify in tree view that

Out of 1000$ payment how much is used/reconciled

Out of 3000$ payment how much is used/reconciled

Out of 6000$ payment how much is used/reconciled

accounting payments1

The above screenshot illustrates how simple it is with this app to identify the reconciled amount or payment partially used.

This was all about Odoo Account Payment Balance App.We hope this snippet of Odoo 10 app helps you to get some insights of odoo v10.You can also download this app from below given link:

click here.

Stay tuned for more information on odoo 10.

Please feel free to reach us at sales@bistasolutions.com for any queries on odoo and its related modules.Also, you can write us through

feedback@bistasolutions.com and tell us how this information has helped you.

Customer Relationship Management

  • by bista-admin
  • Dec 16, 2016
  • 0
  • Category:

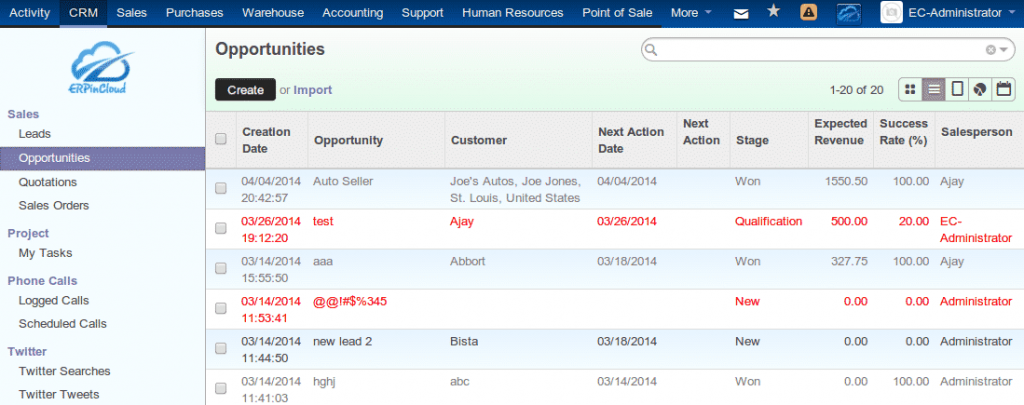
CRM module in ERPinCloud

The CRM module in ERPinCloud allows you to track your best leads and opportunities for SME business. It has capability of customizing your sales cycle, controls statistics and forecasts and setup marketing campaign automation to improve your sales performance.

Customer Relationship Management1

  • Lead Automation

CRM software manages your entire sales process life cycle and automated rules for leads. It also ensures that no leads are lost or neglected.

  • LinkedIn Integration for Contact Management & Twitter Search Integration

CRM solution will import your contacts from LinkedIn and allows you to automate your lead processing using Twitter.

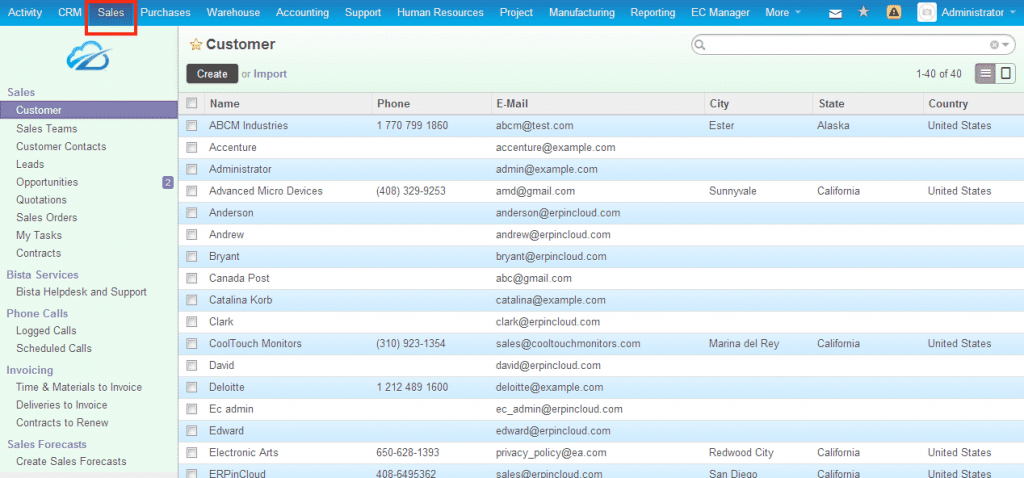
  1. Click on Sales tab

sales tab2

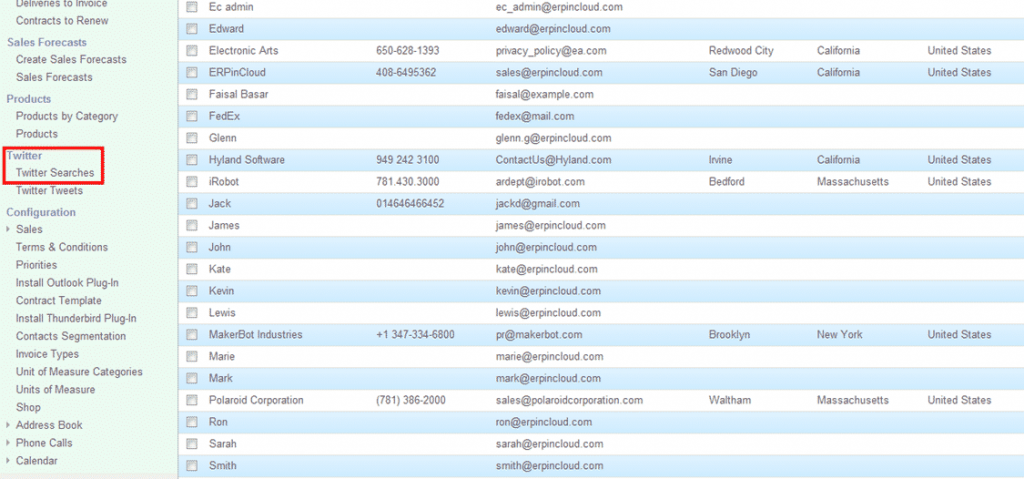
2. Click on Twitter Searches in Twitter menu

twitter-menue

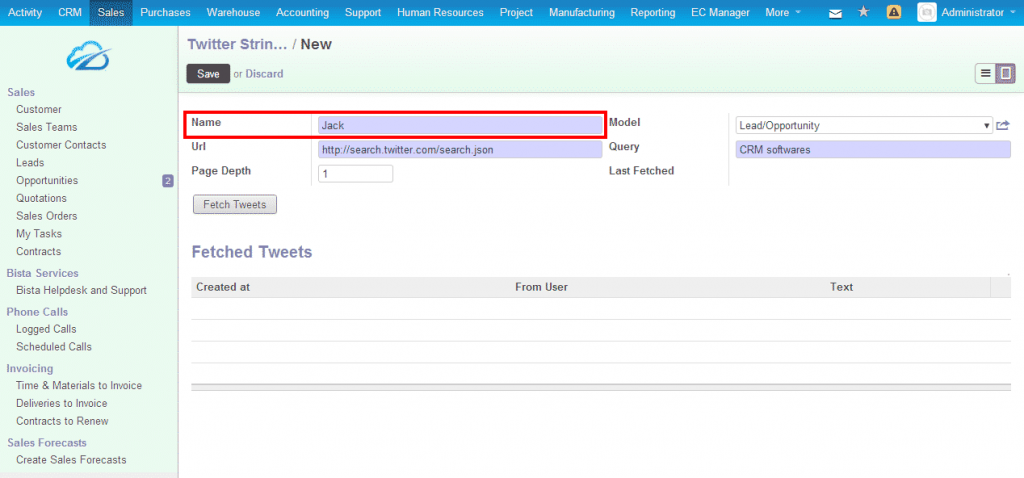
3 – Specify the name

specify name3

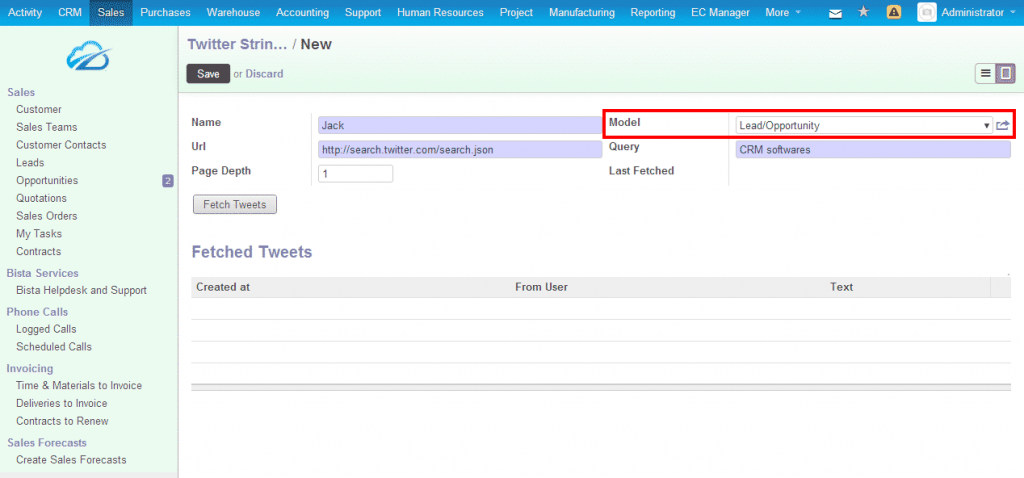
4- Select the Model as Lead/Opportunity

lead opportunity4

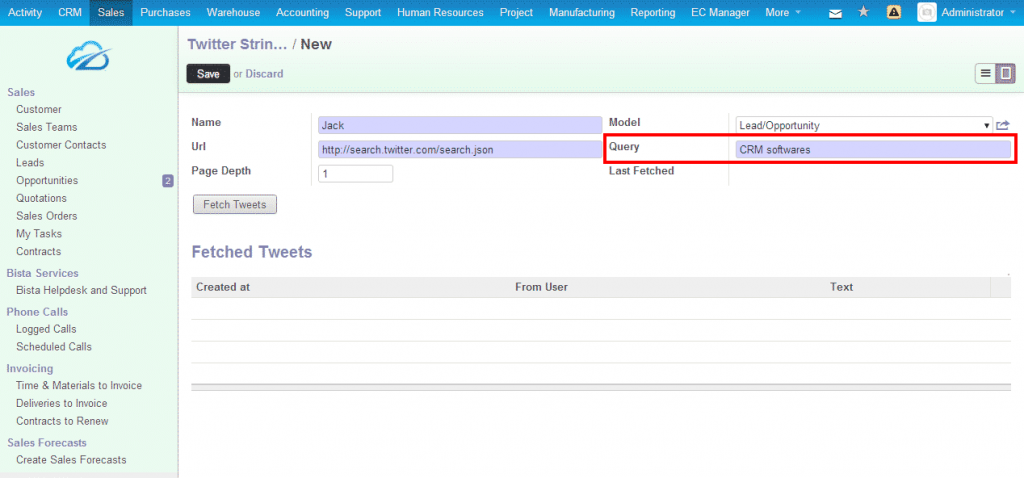
5- Specify the Search query (For eg: Search for CRM softwares“)

query5

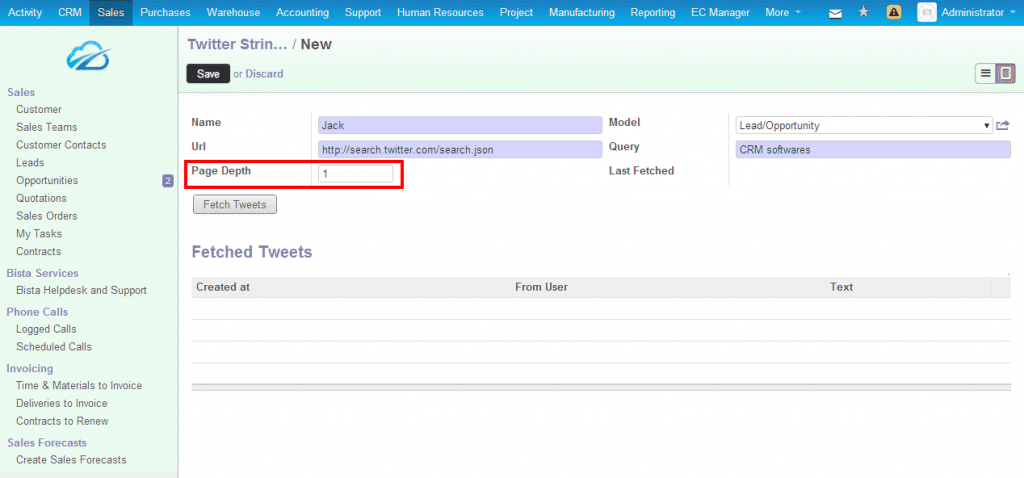
6- Mention the Page Depth

page depth6

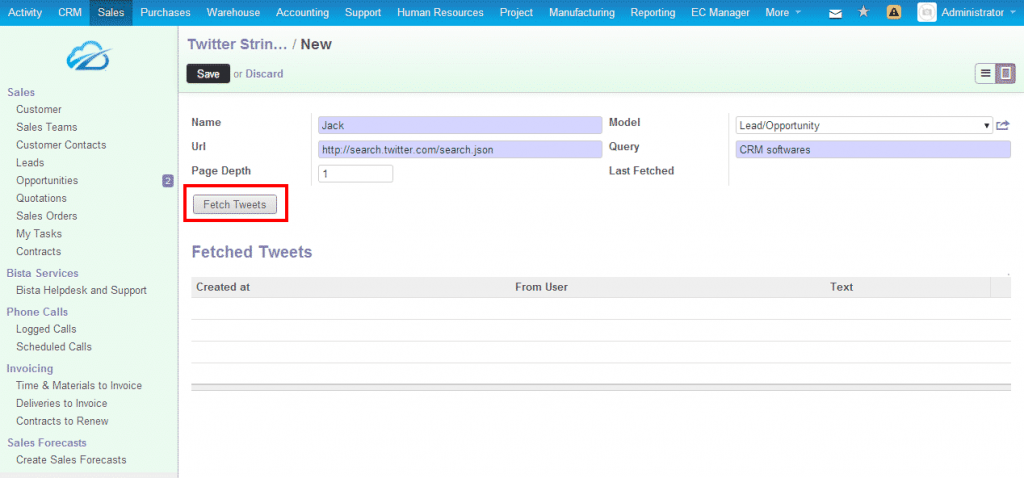
fetch twets 7

7 – All the tweets posted on the specified query get fetched from Twitter

8- The tweets fetched get converted to Lead

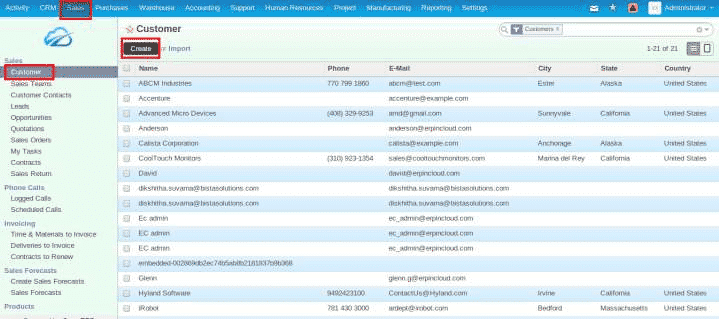
To create customer from LinkedIn

1.Click on ‘Sales’ tab

2.Click on Customer menu

3.Click on ‘Create’ button

customers from linkden8


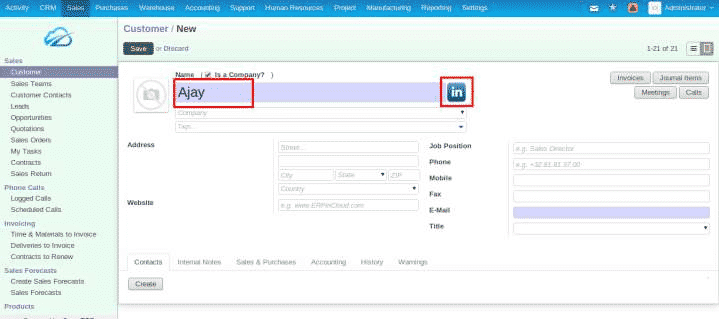
  • Type the name of the customer in the name field and click on ‘LinkedIn’ icon

put name 8

9

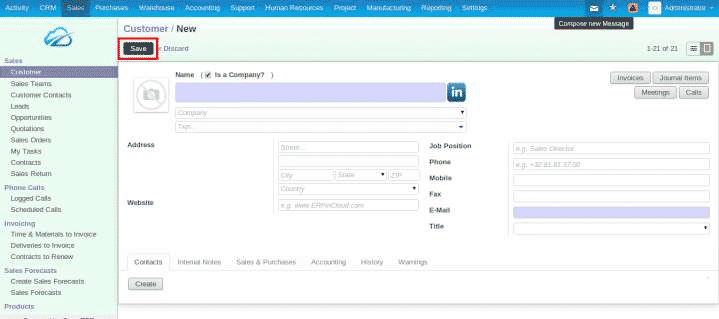
  • Click on ‘Save’

save10

  • Fetch mail Integration With CRM, Outlook & Thunderbird Plug-ins

Synchronize your emails with ERPinCloud CRM .Seamless integration with popular e-mail clients, MS Outlook, Gmail, Yahoo, etc. Central place to capture, track and manage all your emails from the CRM. Due to fetch mail integration with CRM feature ERPinCloud CRM creates leads on reception of mails.

  • Sales Team And Service Team Hierarchy

CRM sales manage the Sales and Service team hierarchy and analyses sales pipeline. Get accurate forecasts with the ERPinCloud CRM business intelligence engine to analyse your sales activities.

  • Task Management for CRM

Task creation on CRM and Helpdesk. Purpose is, when employee logs in the system, he/she can check all his tasks irrespective of created for lead, reminder, meeting.

  • Quotations And Sales Order

Convert opportunities to quotations in one click, convert the quote to a sale order and follow-up sale (invoicing, deliveries, etc.)

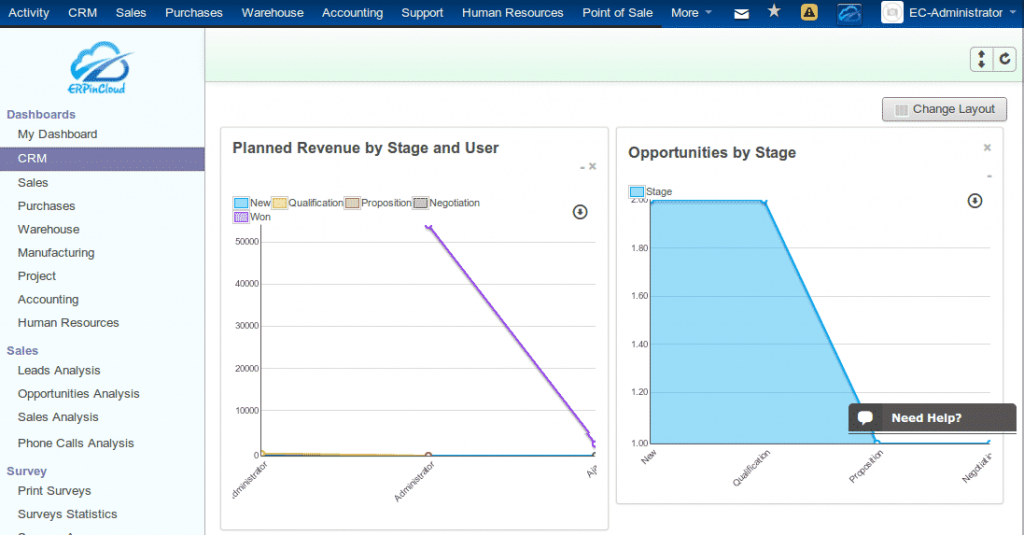
  • CRM Dashboard

CRM dashboard represent the graphical view of parameters set by you and create the convenience to view by the superior in the company.

crm dashboard11

We hope this snippet of CRM in ERPinCloud helps you in conversion of your Leads to Sale Orders seamlessly. Stay tuned at Bista Solutions for more information on ERPinCloud.

Please feel free to reach us at sales@bistasolutions.com for any queries on ERPinCloud and its related modules.Also, you can write to us through feedback@bistasolutions.com and tell us how this information has helped you.

Odoo 10 Expense Module

Odoo 10 Expense Module
  • by bista-admin
  • Dec 12, 2016
  • 0
  • Category:

Introduction:

In odoo v10 a different module for expenses has been introduced which has made the workflow much easier than ever before. This module aims to manage employee’s expenses. As a result of Odoo 10 Expense module a lot of time is saved in building the expense reports as everything can be found under a single roof.

Additional Features Odoo 10 Expense Module:

  • The Odoo 10 Expense module has many additional menus introduced in it to provide a better workflow such as

  1. Expenses to submit

  2. Refused expenses

  3. Reports to approve

  4. Expense reports to pay

  5. Expense reports to approve

  6. Expense to pay,Expense to post.

  • Whether it’s travel expenses, office supplies or any other employee expenditure we can access all receipts and expense submissions from the dashboard of expense module itself and we can even create, validate or refuse payments in just one click.

  • Expense reports: -We can submit our expenses in bulk to our manager using these expense reports.

  • Reimbursements: -Improved reimbursement mechanism with a one-time payment wizard.

  • Attachments: -We can easily attach photos of expenses and thereby could control on expense reports.

  • Email Gateway: -This is also a very important feature in odoo 10 expense module by which we can simply send a picture of our expense by email and odoo will automatically create an expense for us.

Odoo expense module workflow:

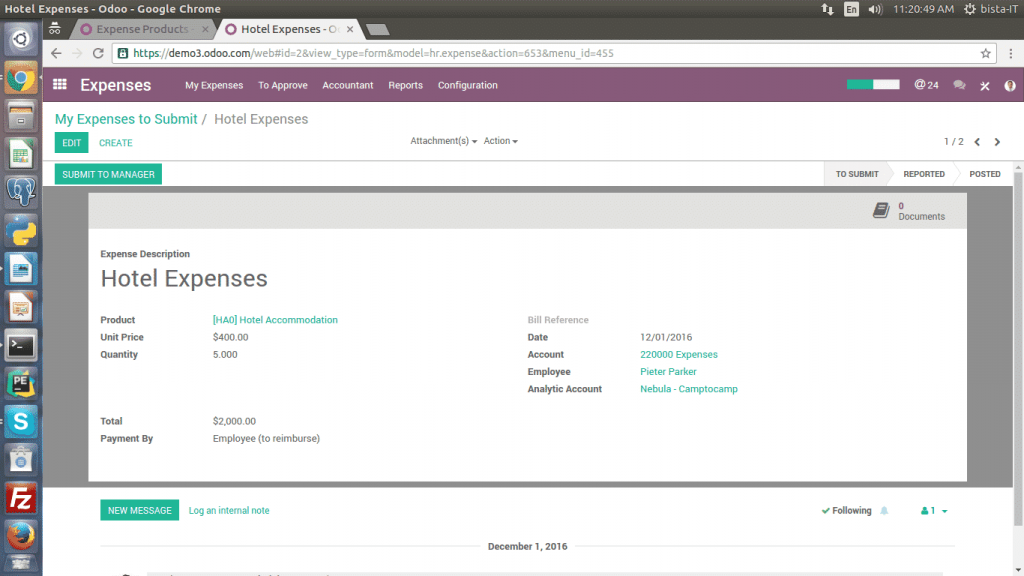
1.Record a new expense: Every employee of the company can register their expenses by navigating through

Expense Application -> Expenses to submit

For each and every expense the employee should have

  • Description:(Includes the reference of the bill/ticket)

  • Product:(type of expense)

  • Price:(e.g accommodation or a quantity as in to reimburse km if employee has travelled by his own car)

record a new expense odoo module

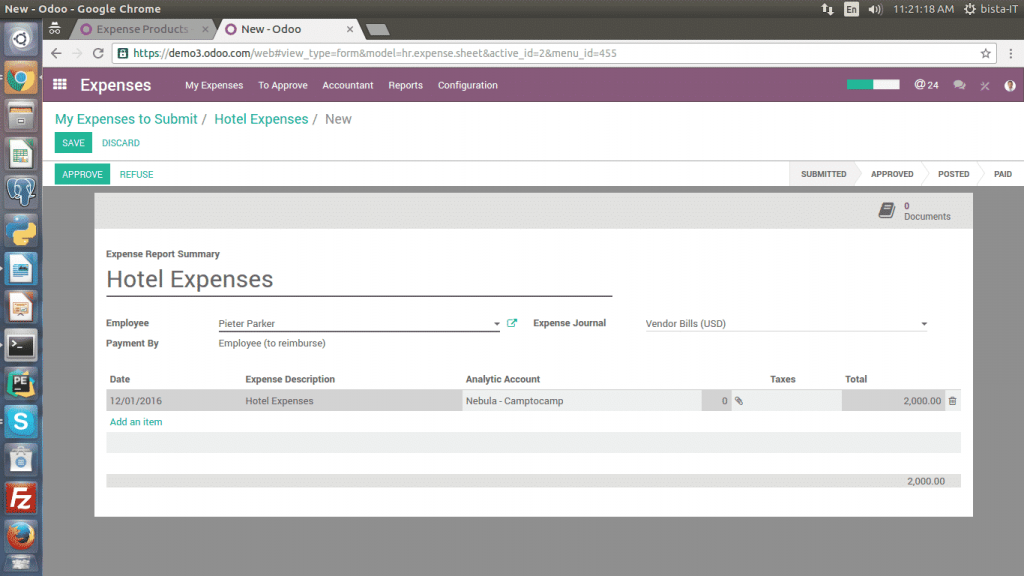
2.Approval by Manager : After creating a record the expense report is submitted to the manager and thereby they receive an email for every expense to be approved.The navigation to this menu is:

To Approve -> Expense Reports To Approve

This enables the manager to check all expenses that are waiting for approval.

approval by manager odoo module

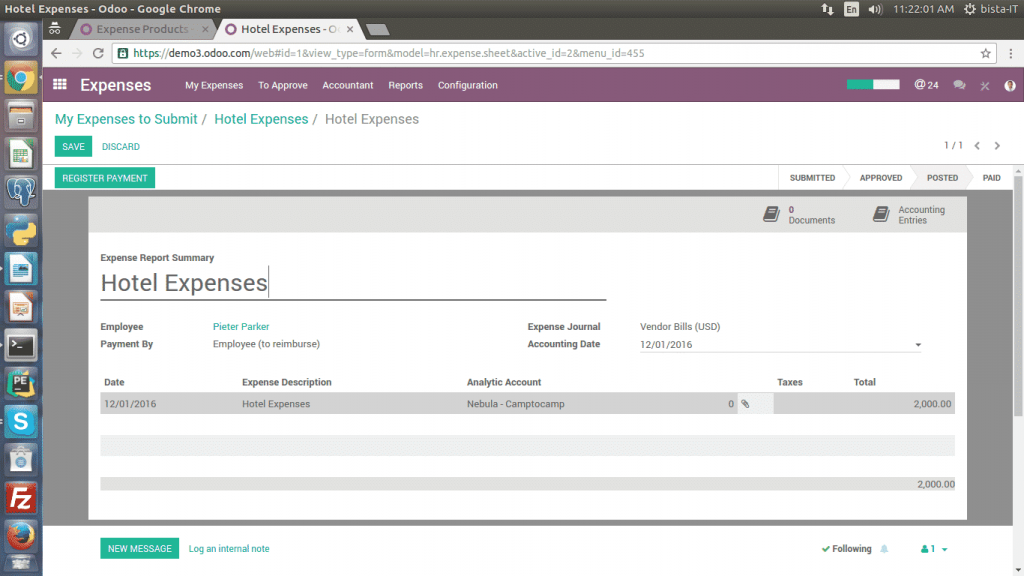
3.Control by Accountant: The expenses which are approved by managers are posted by accountant following the creation of journal entries and it gets posted in your accounting.

4.Re-invoice Expenses: To Customers: If the expense is related to sale order (analytic account), the sale order has new line related to that expense.To invoice customer, we just need to click Invoice button on sale order.

re-invoice expences

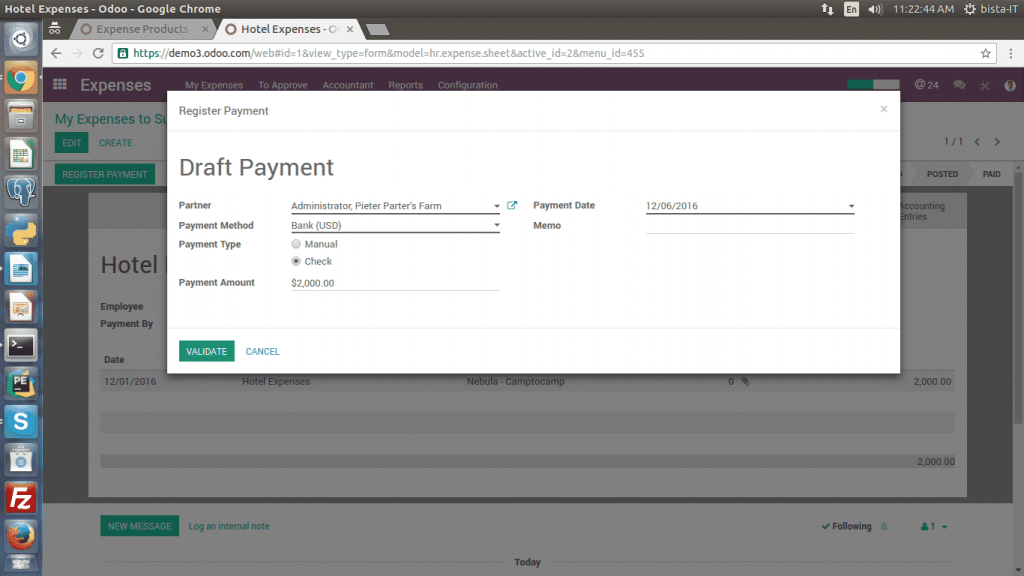
5.Reimburse The Employee : If the employee has paid for his own expenses then the company needs to reimburse employee.All we need to do is just create a payment for the amount due to that employee.

the employee

Benefits of Odoo 10 Expense Module:

  • Saves time on expense reports: We do not need to download a specialized software to maintain records of expenses, everything can be done through one application.

  • Stop losing Receipts : To avoid loss of receipts employees can directly attach copies of their receipts to an expense record.

  • Manage expenses per team: As a manager, they can easily follow expense records across the whole team to keep an eye on costs and ensure budget and target.

We hope this snippet of odoo v10 expenses helps you to get some insights of odoo v10.Stay tuned for more information on odoo v10.

Please feel free to reach us at sales@bistasolutions.com for any queries on odoo and its related modules.Also, you can write to us through

feedback@bistasolutions.com and tell us how this information has helped you.